

Sunday Synopsis #15: OK Quarter...
Sunday Synopsis #15: OK Quarter...
Buff-Ass Bird-Man


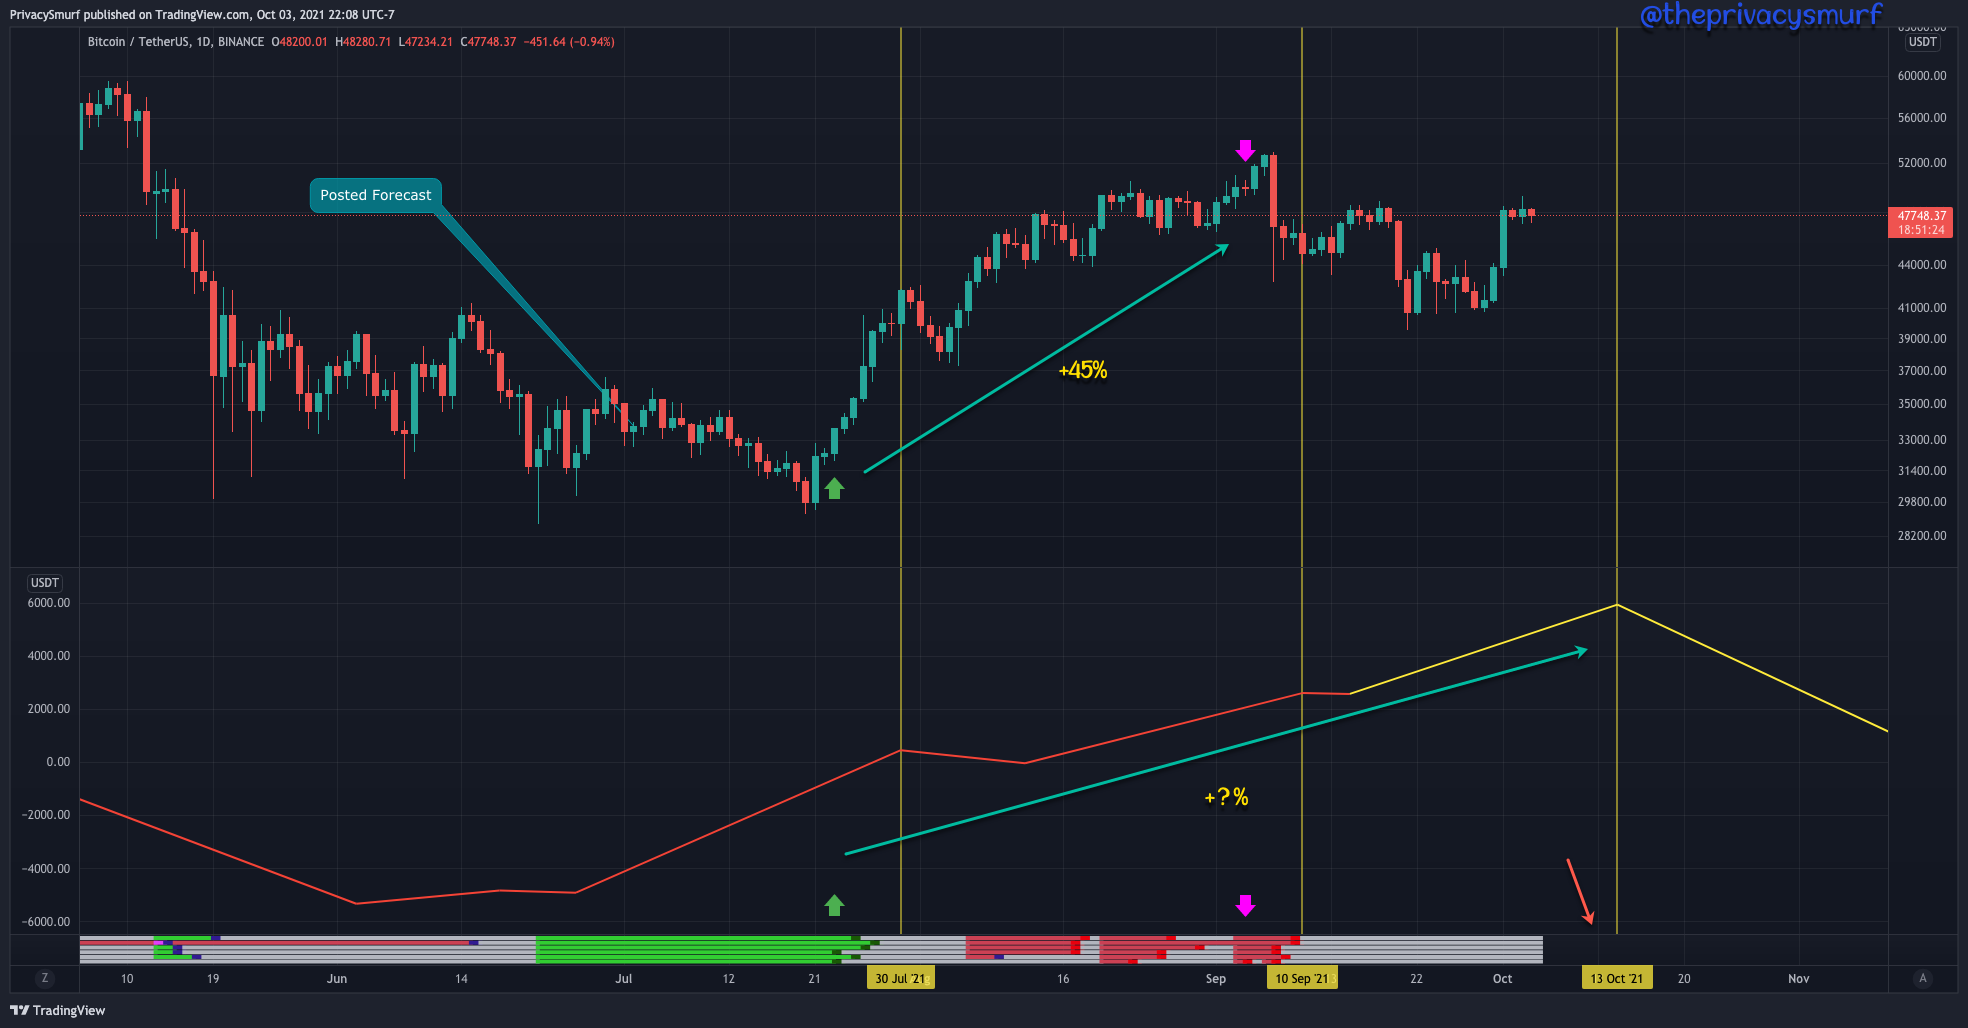
Here we are in the final quarter of the year. It always feels like time has flown by when I get to this point in my analysis. We’ll start this with a recap. Back in July, I posted the Q3 cycle forecast. The final composite at the bottom was pretty darn good.

It pegged the shorter daily cycle peaks pretty well. Using divergence triggers it was possible to catch a great trade in line with the longer cyclical uptrend, buying at a bullish trigger near a cyclical bottom and selling at a bearish trigger near a cyclical peak. The bigger question though is will this older cycle model live up to a long-term cyclical peak in mid-October.
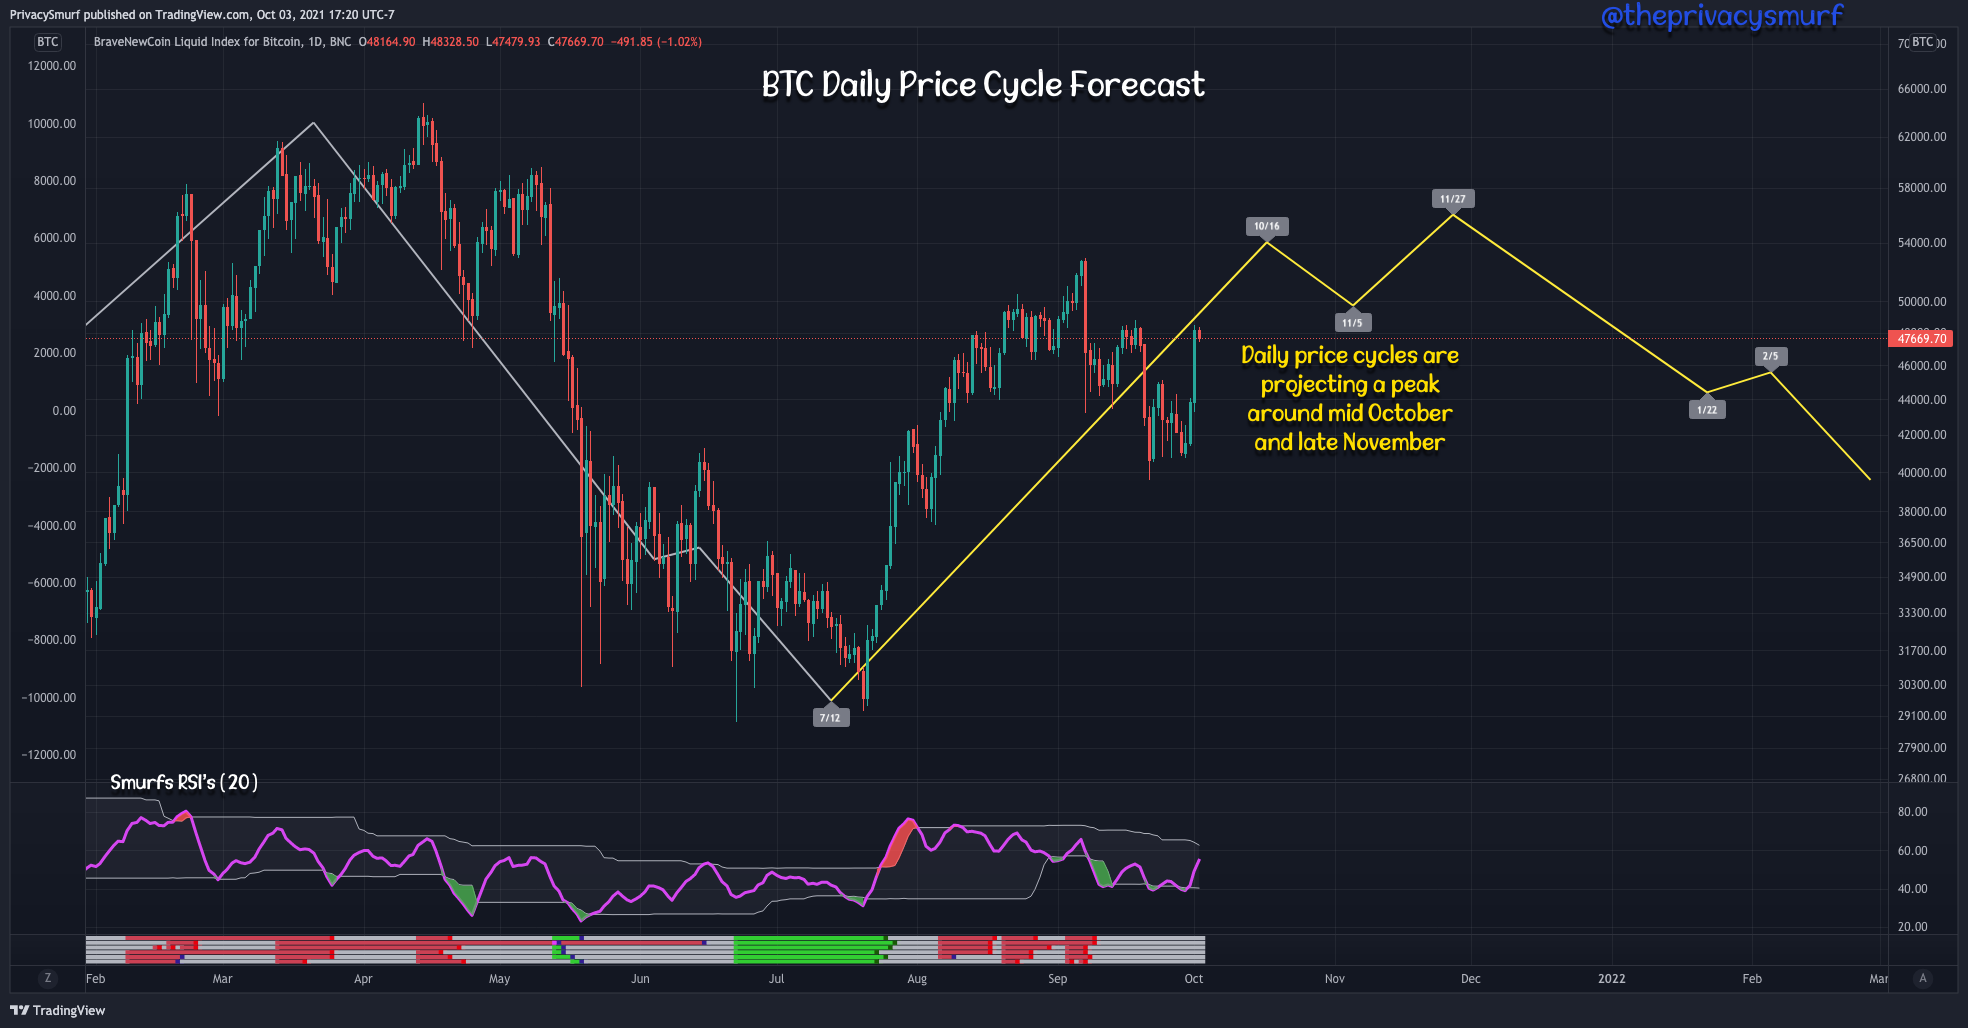
The Quarter 4 forecast is a challenging one to come to terms with. We’ll start with the basic forecast. Keep in mind this yellow forecast line is NOT linked to price on the right. It connects to the time scale on the bottom, plotting a cycle peak around Oct 16 and another around Nov 27. This is pretty straightforward and not hard to accept. The cycles have shifted slightly and are presenting a later date for the peak and are adding in a second rally that wasn’t present in the previous model.
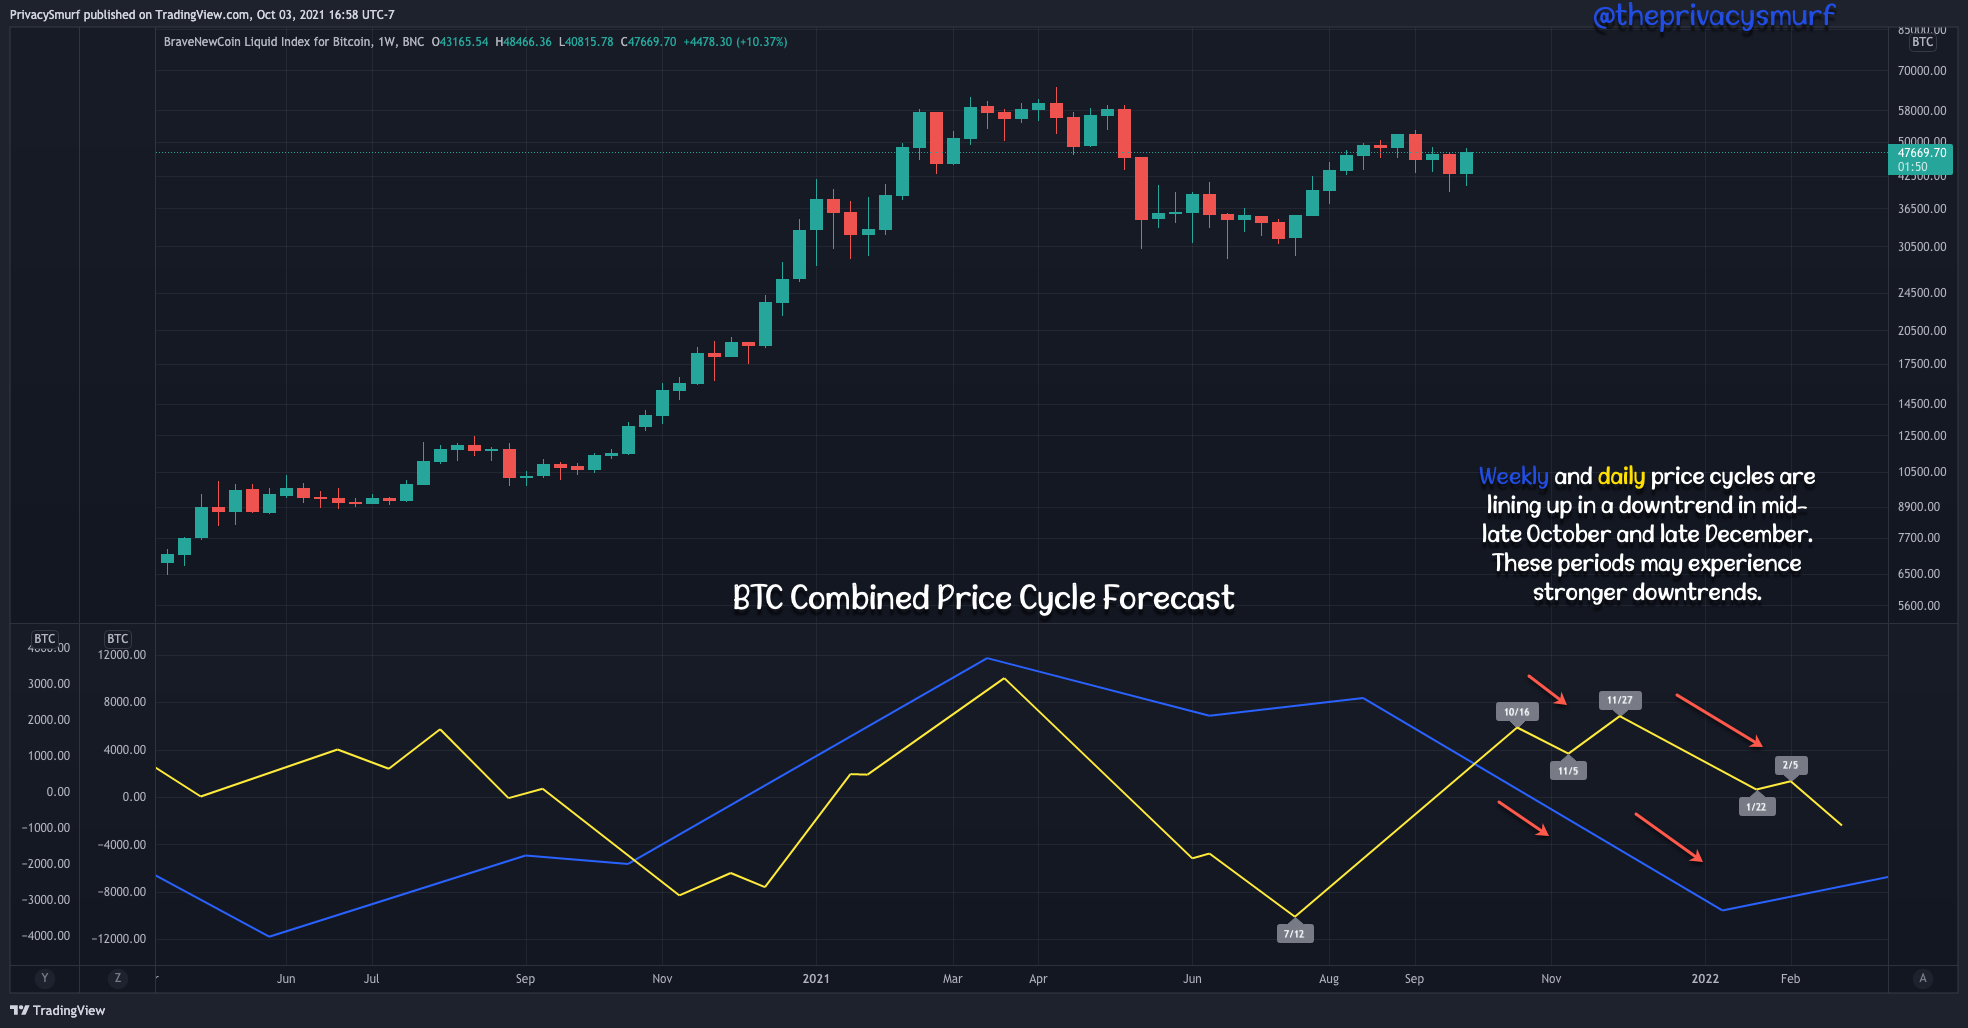
The difficulties with the model show up around more comprehensive data.
The combined weekly and daily price cycles show agreement to the downside in October and November. Price will tend to accelerate when higher and lower timeframe cycles are in alignment, evidenced in the explosive increase Last November to this past March, and the decline in April and May. This picture to me means that bullishness later this year will be working against the cyclical trend and can potentially slow down any explosive growth.
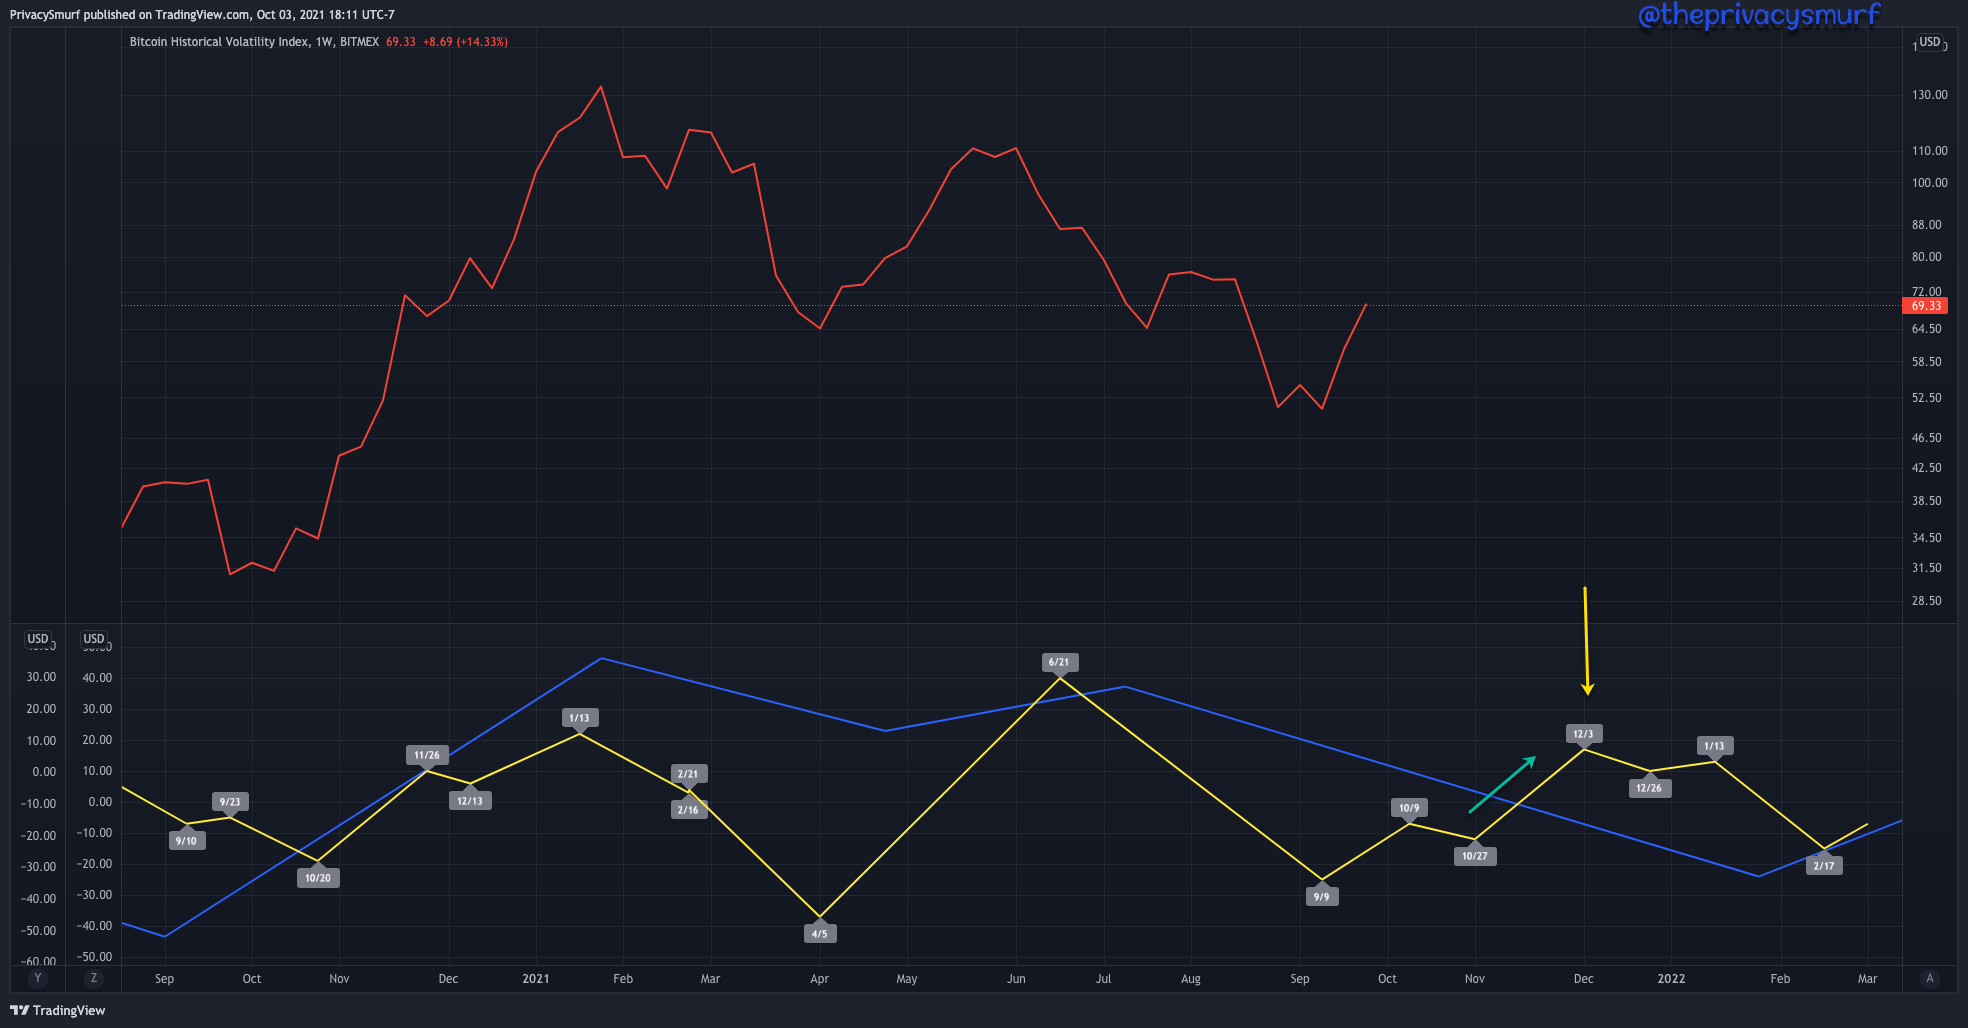
Volatility is plotting a daily cyclical peak around early December which could potentially be the price decline from a late November peak. The weekly cycle has been steadily declining since February. This doesn’t support the idea of wild volatility and parabolic growth greater than what was experienced in the run upp to $64k.
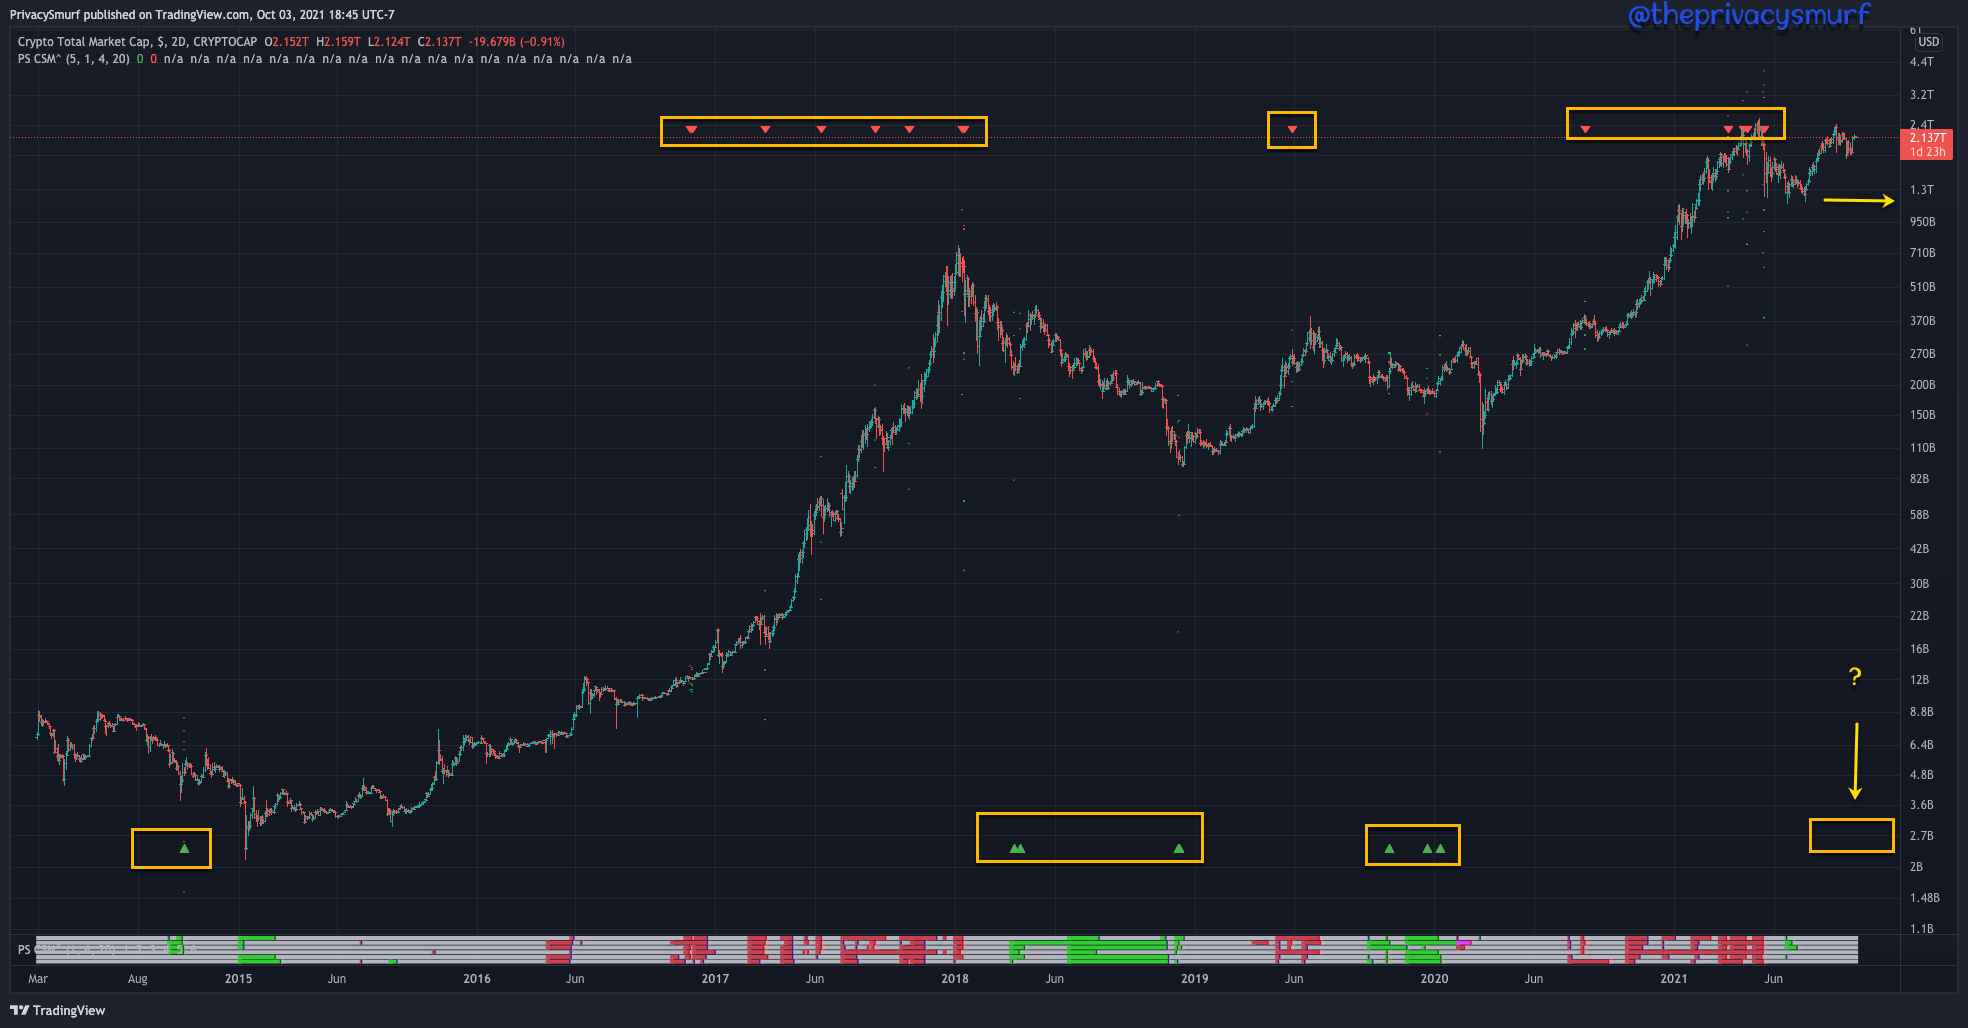
Taking a simplistic view of the Total Crypto Market Capitalization and divergence triggers one can see the pairing of the signals. Bullish signals on the bottom lead to bearish signals at tops in turn leading to bullish signals on the bottom, over and over again. After the most recent decline in the market cap there is no bullish signal yet. While that’s not an indication by itself that the amount of money in the space is going to decline it’s not a strong indication of steady growth. All prior instances of bearish triggers once the market cap started the correction to the average it’s fallen enough to precipitate a bullish setup. At the moment the market cap would have to fall below the 1.3 trillion mark by mid-November to create a bullish setup. Potentially this decline lines up with the daily/weekly cycle low plotted above on the Q4 chart above (Nov 5)
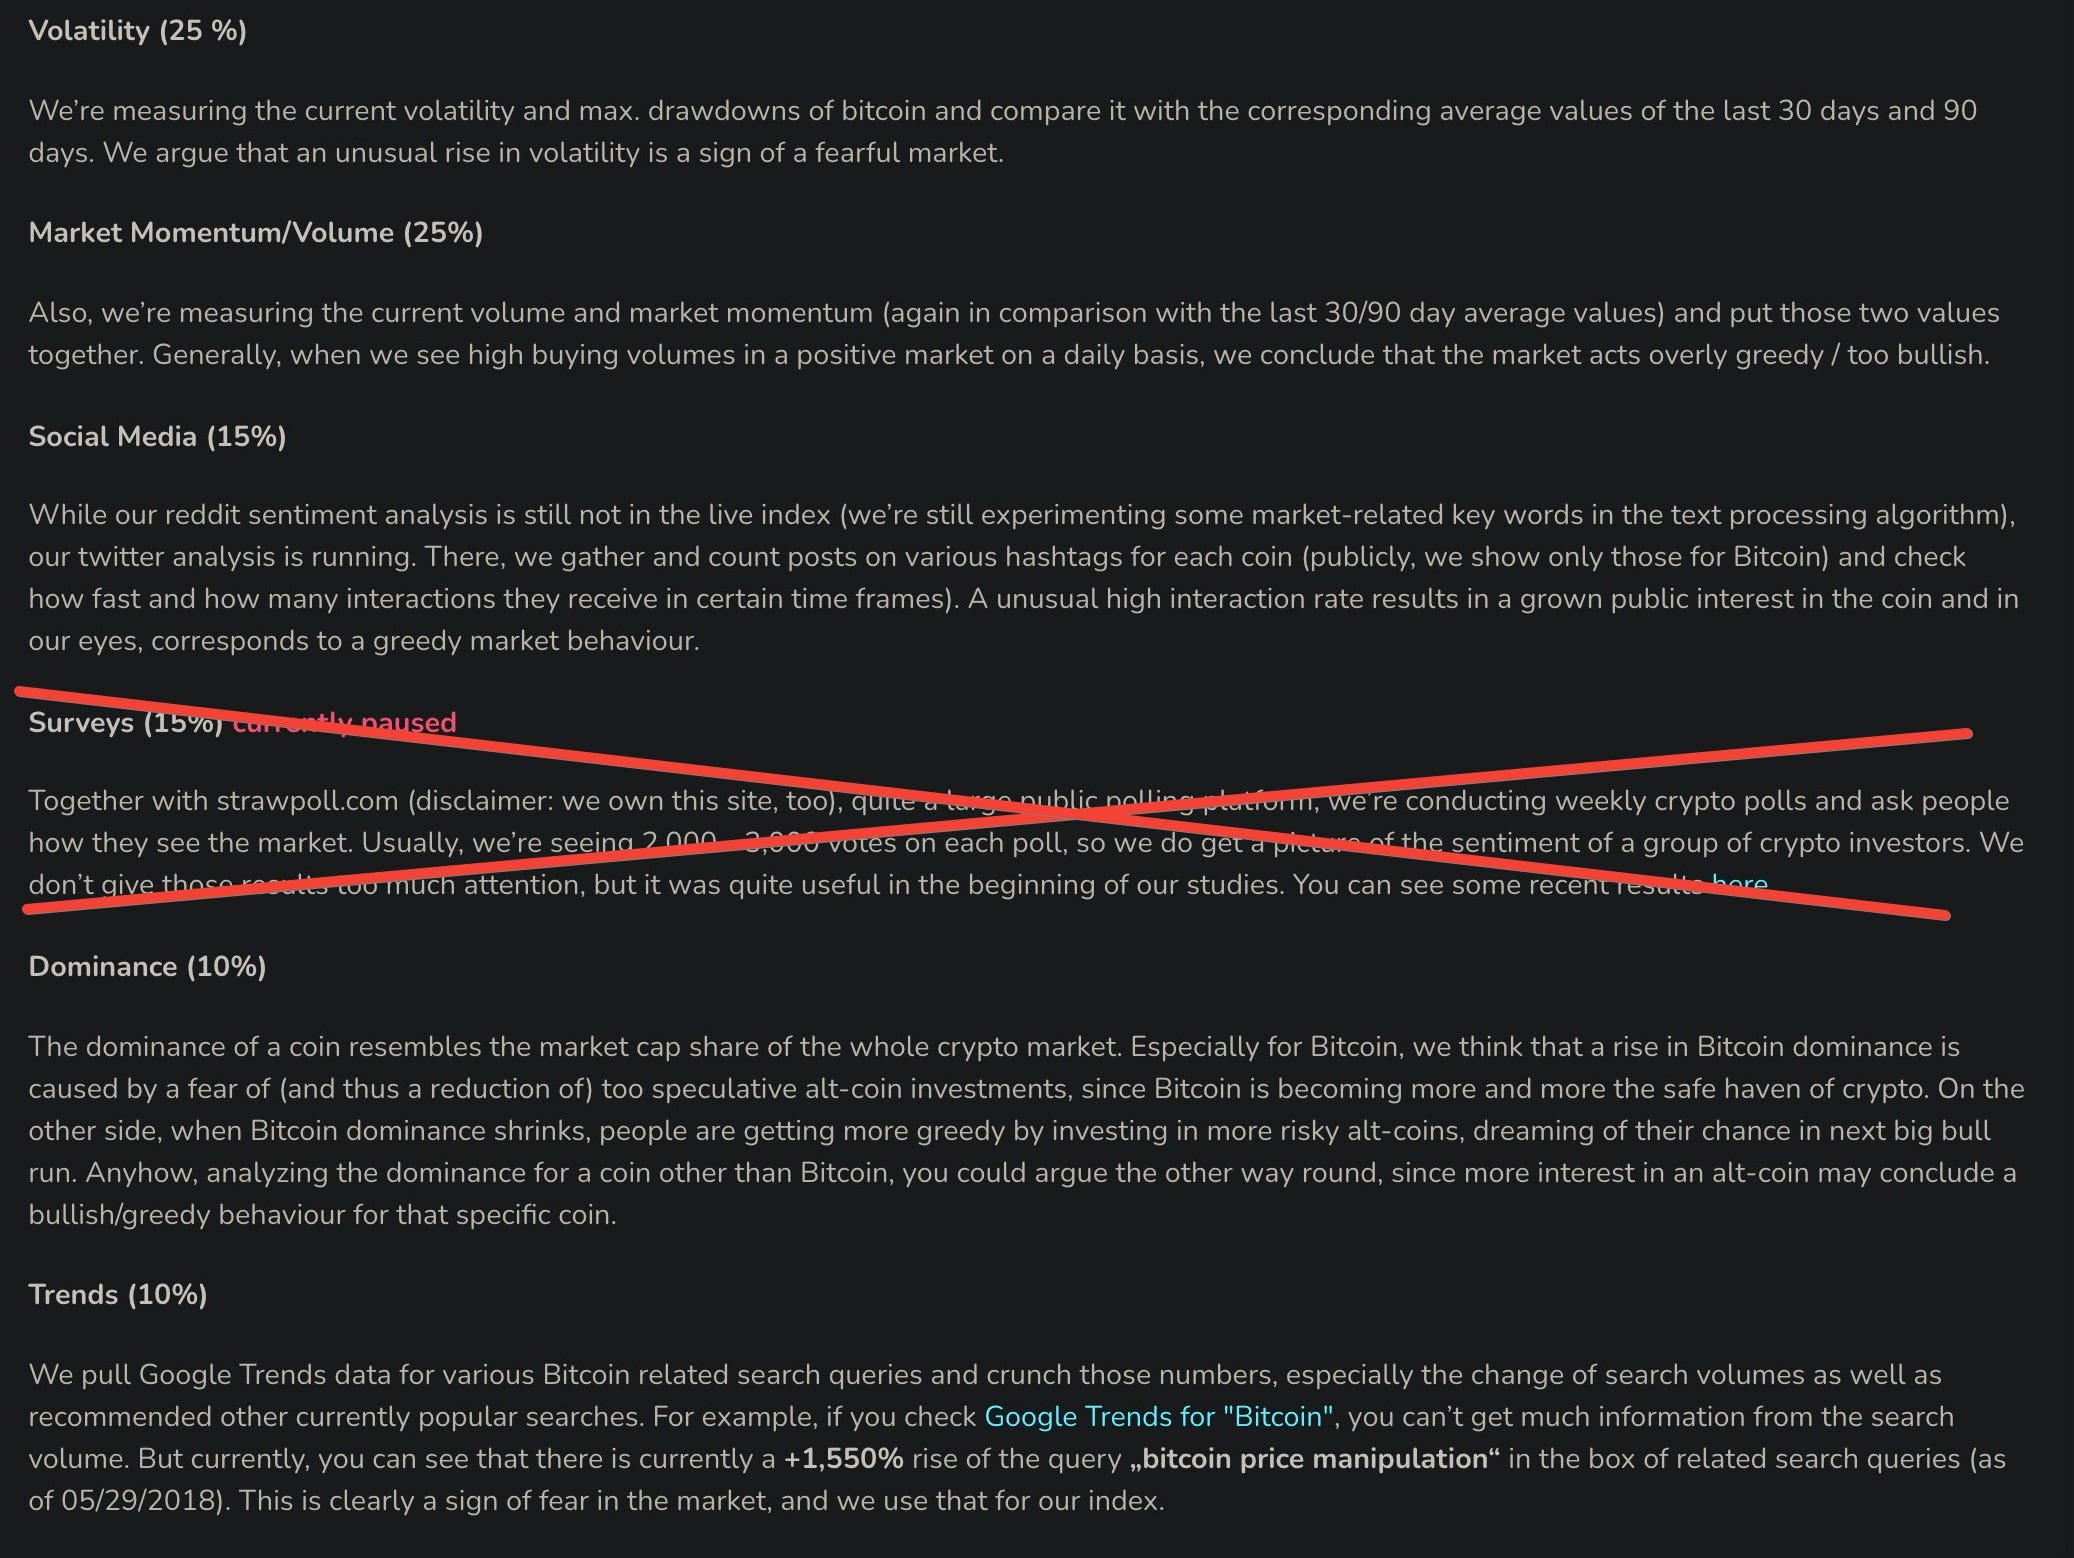
The Fear and Greed index which is described as “emotions and sentiments from different sources” crunched into 1 number is a decent indicator of times of major market turns. Here’s the data that is used to make up the index.
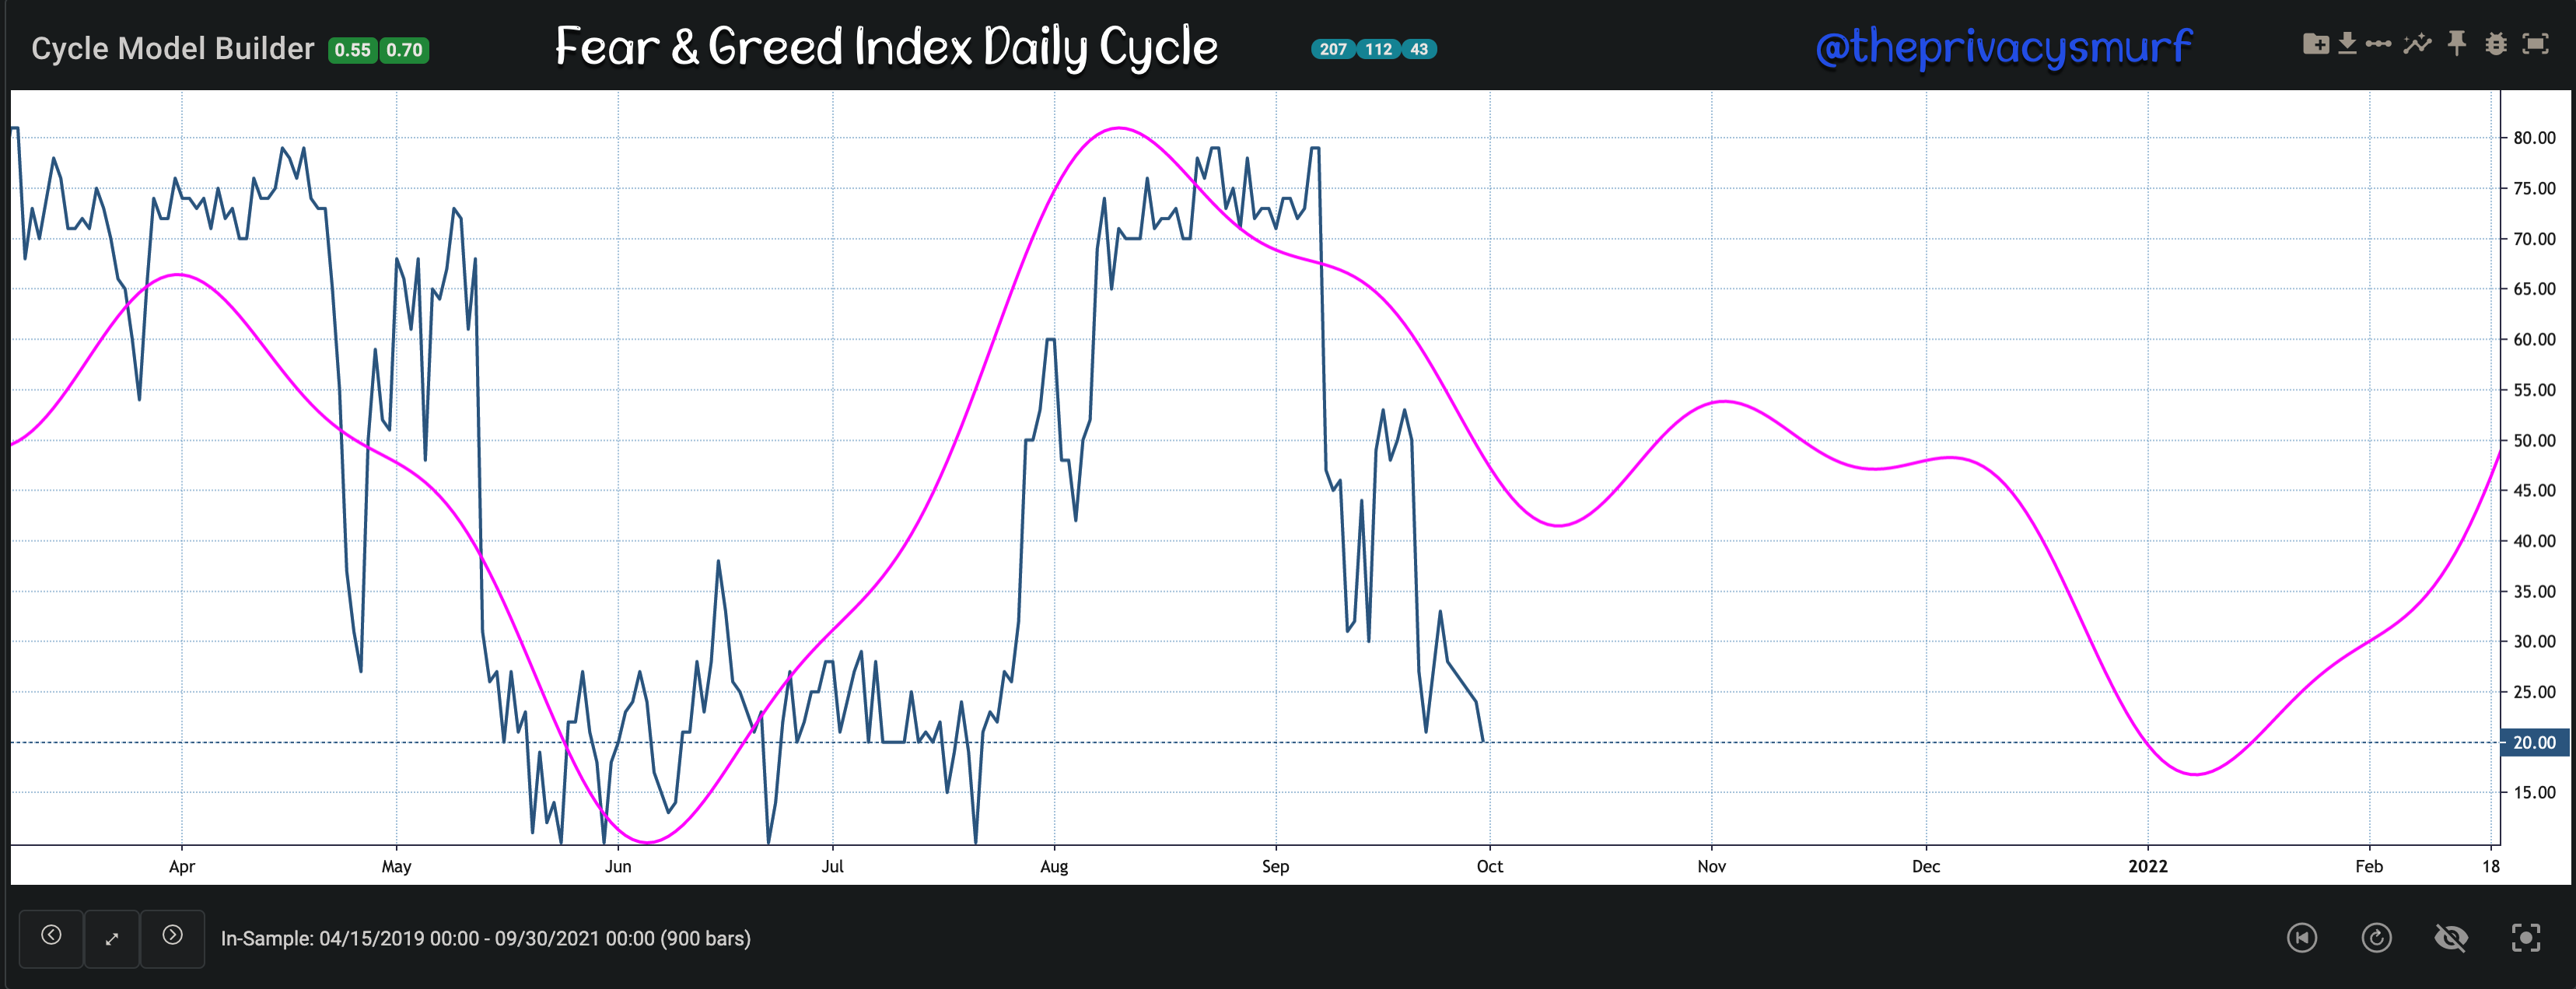
The Fear and Greed Index like anything else is able to be measured for cyclical patterns. It’s nowhere near as great as price action but interestingly it aligns with the timeline of BTC price cycles with an uptick in greed plateauing from early November to early December.
Back near the end of August, I proposed two possible scenarios for BTC. The less ideal second scenario I speculated on is not exact but pretty close to the track I proposed. This scenario is checking more of the boxes than the first bullish scenario. While it’s impossible, by the means I analyze the markets, to peg a price cap things aren’t playing out in a way yet for me to support the idea of an explosive blow-off top on bitcoin this year.


All that aside, I do believe we are still in store for a bullish rally. I just don’t know how high. What does one do to prepare? One thing I do when figuring out where I want to divert my attention is Sector Analysis or simple performance strength searches.
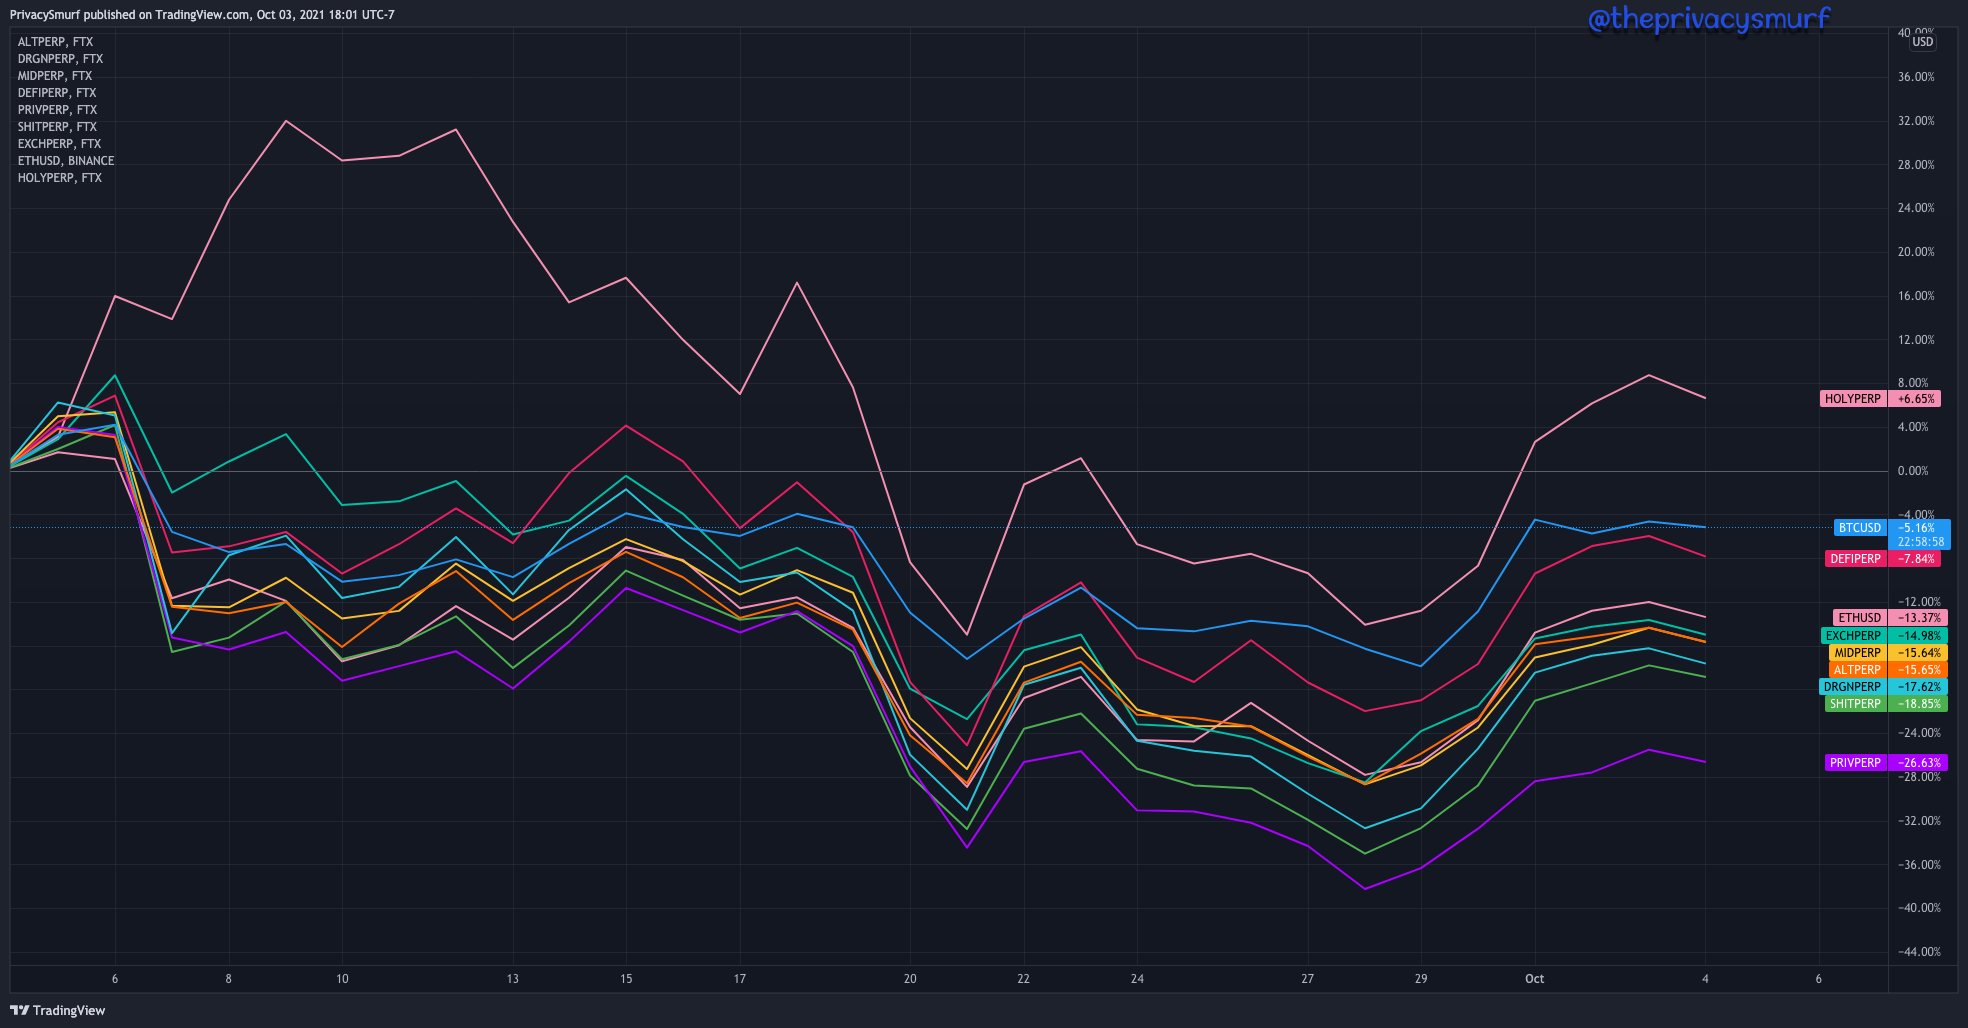
Looking at the FTX Custom Sector Indexes privacy coins are showing bullish divergence while no other sector is. I’d divert some attention to those charts to see if there’s anything of promise among those coins.

Looking at all the FTX custom index performances compared over the last month the following can be drawn from the below chart. Holy Index (SOL, SRM, RAY) are leading the pack. I’d look for good entries there. Defi Index is also not far behind BTC, Ideally, you want to pick assets that are outperforming BTC, but it’s possible these particular assets will take the lead when BTC stalls out.
I’ll leave off the typical BTC, ETH, and ETH/BTC chart today but I’ll bring them out for the Monday post. I know this wasn’t an overly optimistic update but I can only go with what the data is telling me. I feel like it’s best to temper expectations for 100k BTC this year. It’s entirely possible but certain things will have to change for that to happen. Even though at the moment I don’t think we’ll get a parabolic blow-off top this year I think it’s very possible that the standard 4-year market cycles that have typically been present in BTC may be less prevalent, meaning a lower likelihood of a multiple-year bear market. Analyzing data at the beginning of the year will give a better idea of what to potentially expect in those regards. Regardless, I’ll be here every step of the way to keep you up to date with my analysis.
@theprivacysmurf
PS: Prices are up now and most likely won’t ever change in the future. I’ll add in an option for paying with BTC which will be at a discount as well. If you are following my writing there have been multiple occasions to capitalize on moves and profit. The weekly updates would consistently keep you on the right side of the market. If nothing you are reading here is working for you I wanna know why! If you don’t understand anything or have suggestions please comment! I’m happy to help in any way I can so you can make sense of all this market madness and be profitable.
I can’t find any documentation on Substack about recurring subscription prices staying the same or going up with a price increase. My partner seems to think it doesn’t matter about an active subscription and the same prices will be reflected with a price increase. I think that’s a bit lame if that’s the case because I feel like one should be able to lock in a price they were previously paying as a reward for being involved early on but I guess that may not be a thing. Sorry.
Either way, I still think the amount to be gleaned from the newsletter relative to the cost is still undervalued and I’ll do my best to continue to deliver top-tier analysis each week and be way more on time with the posts.
The beta test for my indicators has only a handful of spots left if you want in you can fill out this form. It’s the colored indicators at the bottom of some of the charts that are signaling price corrections. Ideally, that indicator set will be live and for sale next year.
Cheers
Amazing analysis Terry, its incredible how many factors you take into account to make trading decisions, simply amazing, great to know you. Cheers
This was good. Very good