

Topical Thursday #7: Forced Liquidity
Topical Thursday #7: Forced Liquidity
One person's pain is another person's pleasure.


Creating liquidity is something I’ve sort of touched on in roundabout ways in other posts.

I also expressed concern about a possible forced liquidity event when BTC price ventured into the 40-42k region in one of the last Sunday posts. Forced liquidity events can be both good things and bad things. It really just depends on how it shakes out after. I know that’s not a helpful statement so I’ll take some time to talk about them all with a few examples.
To be useful in analysis and your trading plans one needs to know what liquidity is. In this particular context, it’s the amount of active buy and sell orders on the order books of exchange, it’s how much of an asset is available to the market. Liquidity is everywhere. There are constantly buy and sell orders moving around at every possible price point. Sometimes certain price points will have lots of orders build up around them. The most recent retracement of BTC brought the price all the way down to just under $30k. There are most likely tons of buy orders at $30k because if the price dips again that’s a rock bottom price to buy. These buy orders would be an example of a liquidity pocket. The most recent retracement of BTC occurred at $64k. There are most likely tons of sell orders at $64k because if the price returns to that level people will want to capture profits they recently missed out on just in case the price level fails to hold again. These sell orders would be an example of a liquidity pocket.

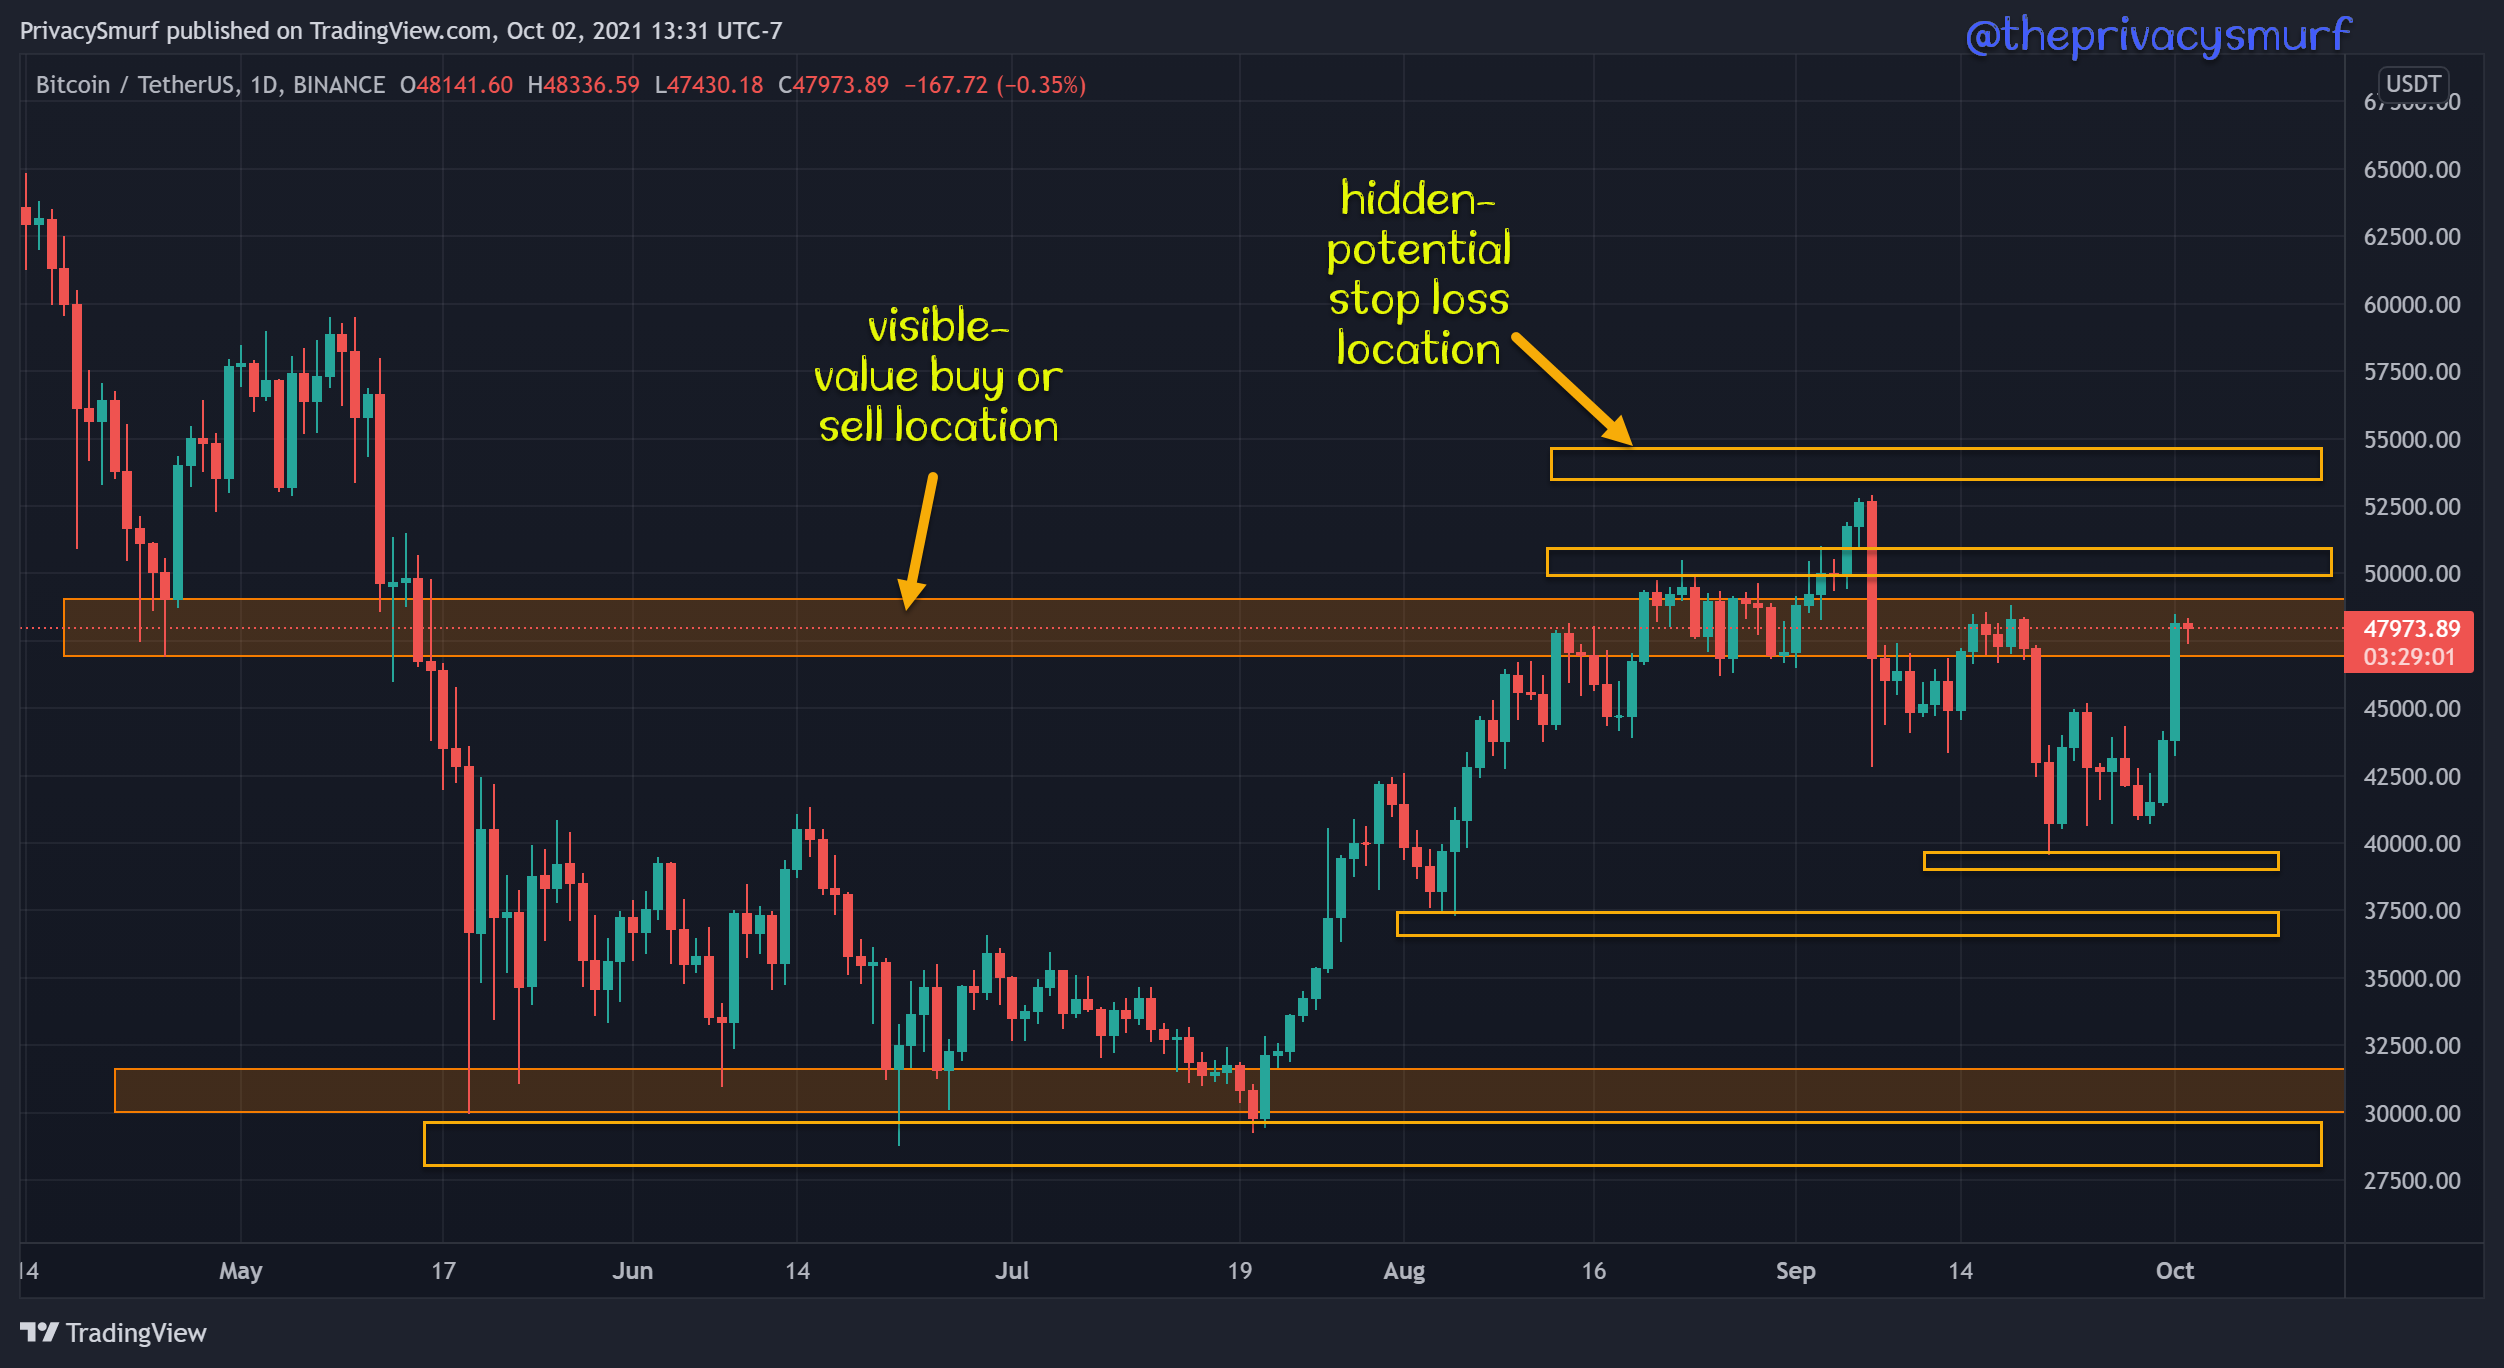
Another thing that is critical to understand is that every buy order is filled because there is a sell order on the other side. Same in reverse, every sell order needs a buy order. For us non-whale traders this isn’t much of a problem. For whales and institutional level traders oftentimes there is not enough of one side of orders. This is why it’s good to know these visible pockets of liquidity because there are hidden pockets as well just beyond them.
Most traders are familiar with stop losses. This is a price level that the traders have deemed as a line in the sand. If the price exceeds this level during a trade then they want out because the executed trade idea is a bad one and they don’t want to lose any more money. Having these stop losses defined before entering a trade is very important and advised. These price levels are also hidden pockets of liquidity. Know or suspected stop loss areas can be manipulated to force liquidity on the market. A whale can market sell an amount greater than the number of limit buy orders in the orderbooks which while drive the price down. Meanwhile, they will place limit orders of the same amount sold or more at a lower price knowing they will likely get the buy orders filled by stop-loss sell orders or panicking inexperienced traders afraid of the price crashing, the worst-case scenario, and selling to get out of the market.
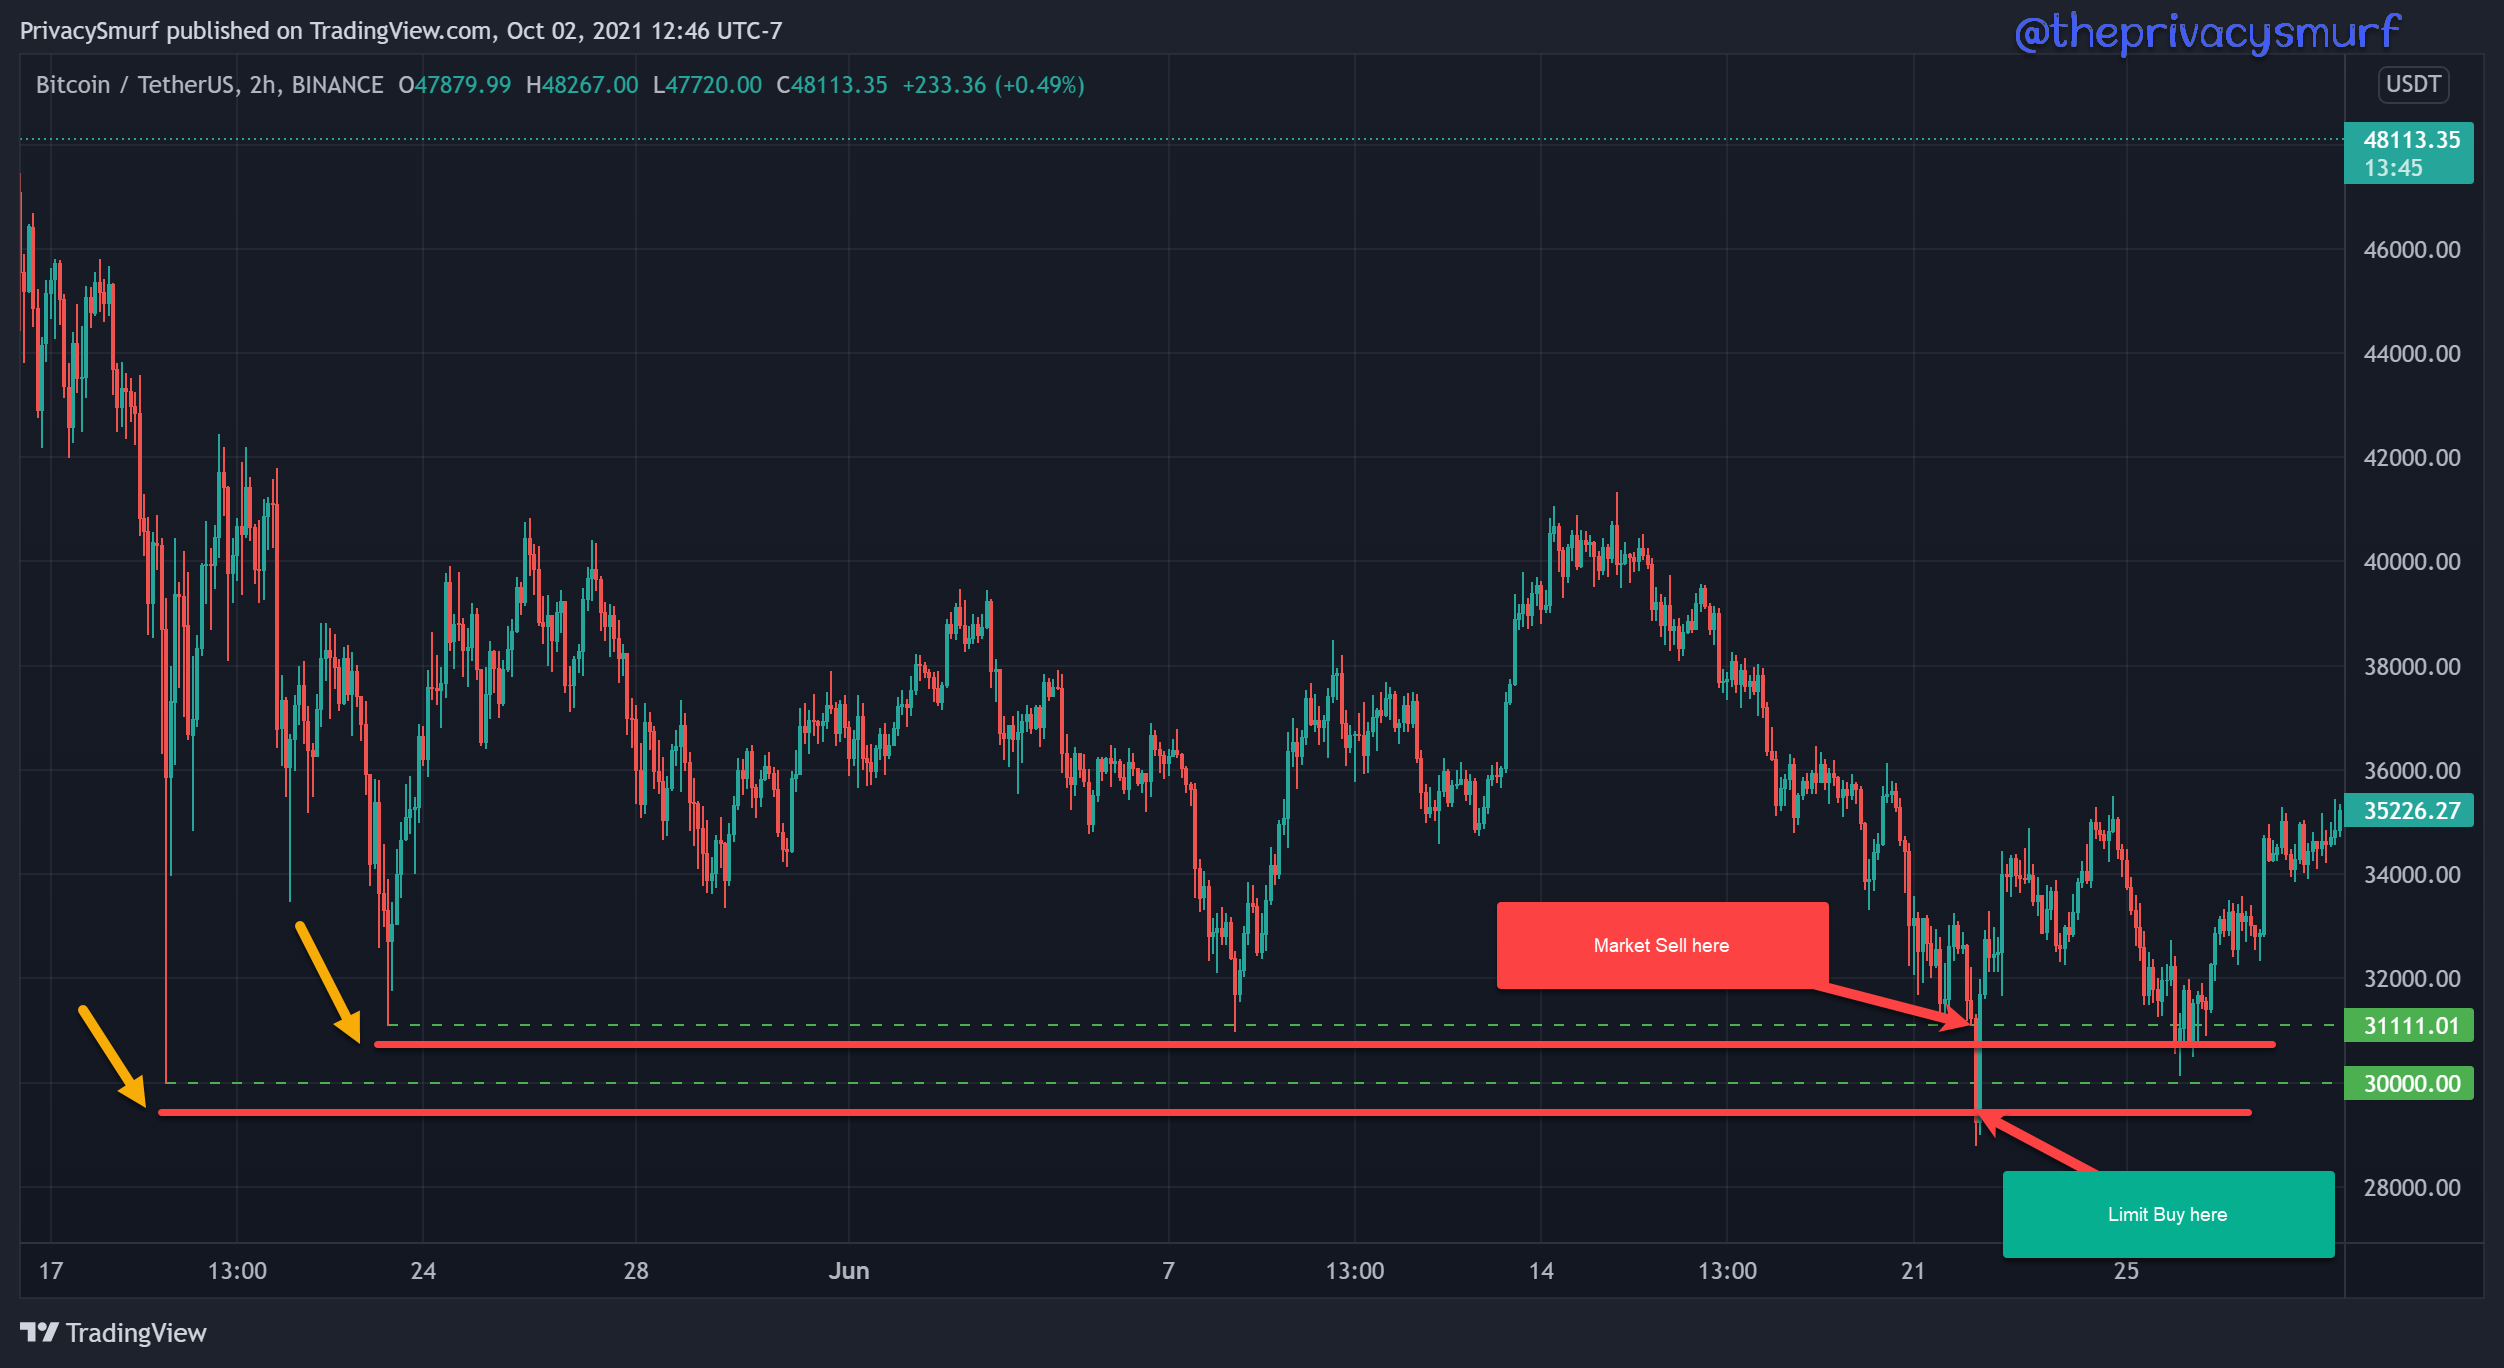
This is a forced liquidity event. It’s impossible to know but with the market holding up at $31k before and other technical indicators plotting bullish signals there’s is an argument to be made that price would not have gone below $31k without that forced liquidity event.
These events are good because if other technicals are plotting bullish signals they confirm the convictions of larger level players. It shows this is a price that they are willing to buy at. I imagine few buy BTC with the end goal of a less profitable investment. Large-scale buying (accumulation) at a price level is a bullish indication for both the long-term picture and intermediate-term price action. Long-term it is a price level that will likely be defended. Intermediate-term large-scale buying will bump up the price once the panicked sell orders and stop-losses are filled.
These events are also bad because they plant a seed of weakness in the market. Levels that were previously held are weaker as orders that would have held up the price are now filled and off the books. An argument could be made that orders will just be put back in at that price, but an equal argument could be made that orders now will be put lower because people may think the same thing would happen and they could potentially get a lower price filled on that flash crash. Also, this hasn’t brought leverage into the picture. If the market has too much leverage (borrowed money) when these liquidity events occur it becomes a cascading failure and the price doesn’t bounce back.

It’s important to be wary of these possible events as the price approaches higher-timeframe supports and resistances because these areas will have the most liquidity, both visible and hidden, to execute large-scale trades. During crashes or rallies around these price levels, it’s critical to monitor technical indicators to validate or invalidate the ideas of price continuing in the previous direction. It also reinforces the reasoning for taking profits while prices are rising so you don’t have the excess emotional pressure of losing gains weighing on you while prices are crashing.
At the moment below are the zones places I take caution and watch technicals to support my trading plans and trade execution.
Later today I’ll drop the Saturday Showcase for some altcoin analysis.
Tomorrow is the Q4 Market Update.
Also, prices will be going up next week and I don’t think any of you have to worry about that. I have to check about how subscriptions work but I think if you are on a recurring plan it will continue at the existing price. I’ll verify that and make sure to post about it.
See you in a little bit.
@theprivacysmurf
I am still not sure what it means to watch these zones in contrast to when the price is between these zones. What do we do differently as the price approaches?q
So, the point is 1) watch for these zones of support and resistance - given they are magnets for whale activity and 2) consider these zones when taking profits so that you can avoid regret if the market is forced lower. Sound about right?