

Topical Thursday #1: Candlestick Patterns
Topical Thursday #1: Candlestick Patterns
Setups. Setups everywhere.

Topical Thursday will be an overview of a specific aspect of the market, a trading technique, or some research I conduct that I feel is critical to understanding the markets or to the success of any trading and investing career. If you have any topics you’d like covered feel free to comment or contact me and if it’s in line with the methodologies I follow I’ll certainly include it.
This newsletter subset will be posted on Thursdays and is only available for paid subscribers. If all that sounds advantageous to you consider the paid subscription.
Price action is king. Topic over.
Just kidding. Well, not about price action being king. That’s honestly the most important thing you need to know in this business. What is price action? Simply put it’s buying and selling plotted over time. Every indicator, every line you draw, every pattern you “see” is created by or is measuring price action. Whatever price action is doing right this second trumps EVERYTHING you add to the charts. The sooner you can understand that the sooner you’ll be more profitable and less time you’ll spend learning the hard way. It doesn’t matter what models you study (Wyckoff, Price Cycles, Fibonacci Sequences, Elliot Wave Theory). It doesn’t matter what patterns you identify (bull flags, wedges, head and shoulders, trendlines). It doesn’t matter what indicators or oscillators you apply (moving averages, RSI, Volume Profile, Market Cipher). I know that sounds a bit excessive but I’m trying to drive the point home. Price action DOES NOT have to respect those things. All the stuff you can put on your charts can be rendered ineffective every👏single👏time👏 just because people keep buying or selling. With that out of the way, we can now move on and talk about some ways I like to read and interpret price action.

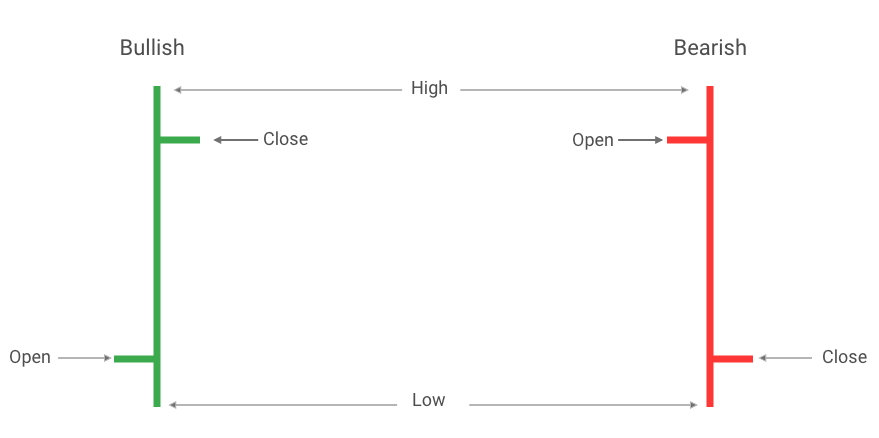
Just so we are all on the same page there are two ways I like to view price action on charts and how I communicate through my analysis. Both formats read the same way and contain the exact same information, they are just visually a different display. The most common display of price action is the Japanese candlestick.

A less common display, although my favorite is the Open-High-Low-Close Bar (OHLC Bar). You can tell it’s not popular because Investopedia which covers pretty much everything doesn’t have a graphic of this…
There’s a billion and a half candlestick/bar patterns that you can learn to identify on the charts. They all vary on statistical validity when applied without any additional technical analysis. Also the lower the timeframe the less statistically valid they become. I only concern myself with 3 price action patterns. These patterns by themselves can achieve overall profitable results. That’s always the base I search for when backtesting strategies. I want a setup that without ANY analysis will be profitable at least 55% of the time. The idea is that I can apply filters and technical analysis to optimize an already decent strategy. Why wouldn’t I do that with a strategy that’s less than 50% profitable? A polished turd is still a turd.
Timing entries to positions whether you are an investor or a trader is about identifying when the price will begin moving in your favor. One pattern that has a great success rate is the engulfing candle formation. This is a 2 candle/bar pattern. Illustrated below, an engulfing candle is when the 2nd candle’s body (open to close) is larger than the 1st candle's body.

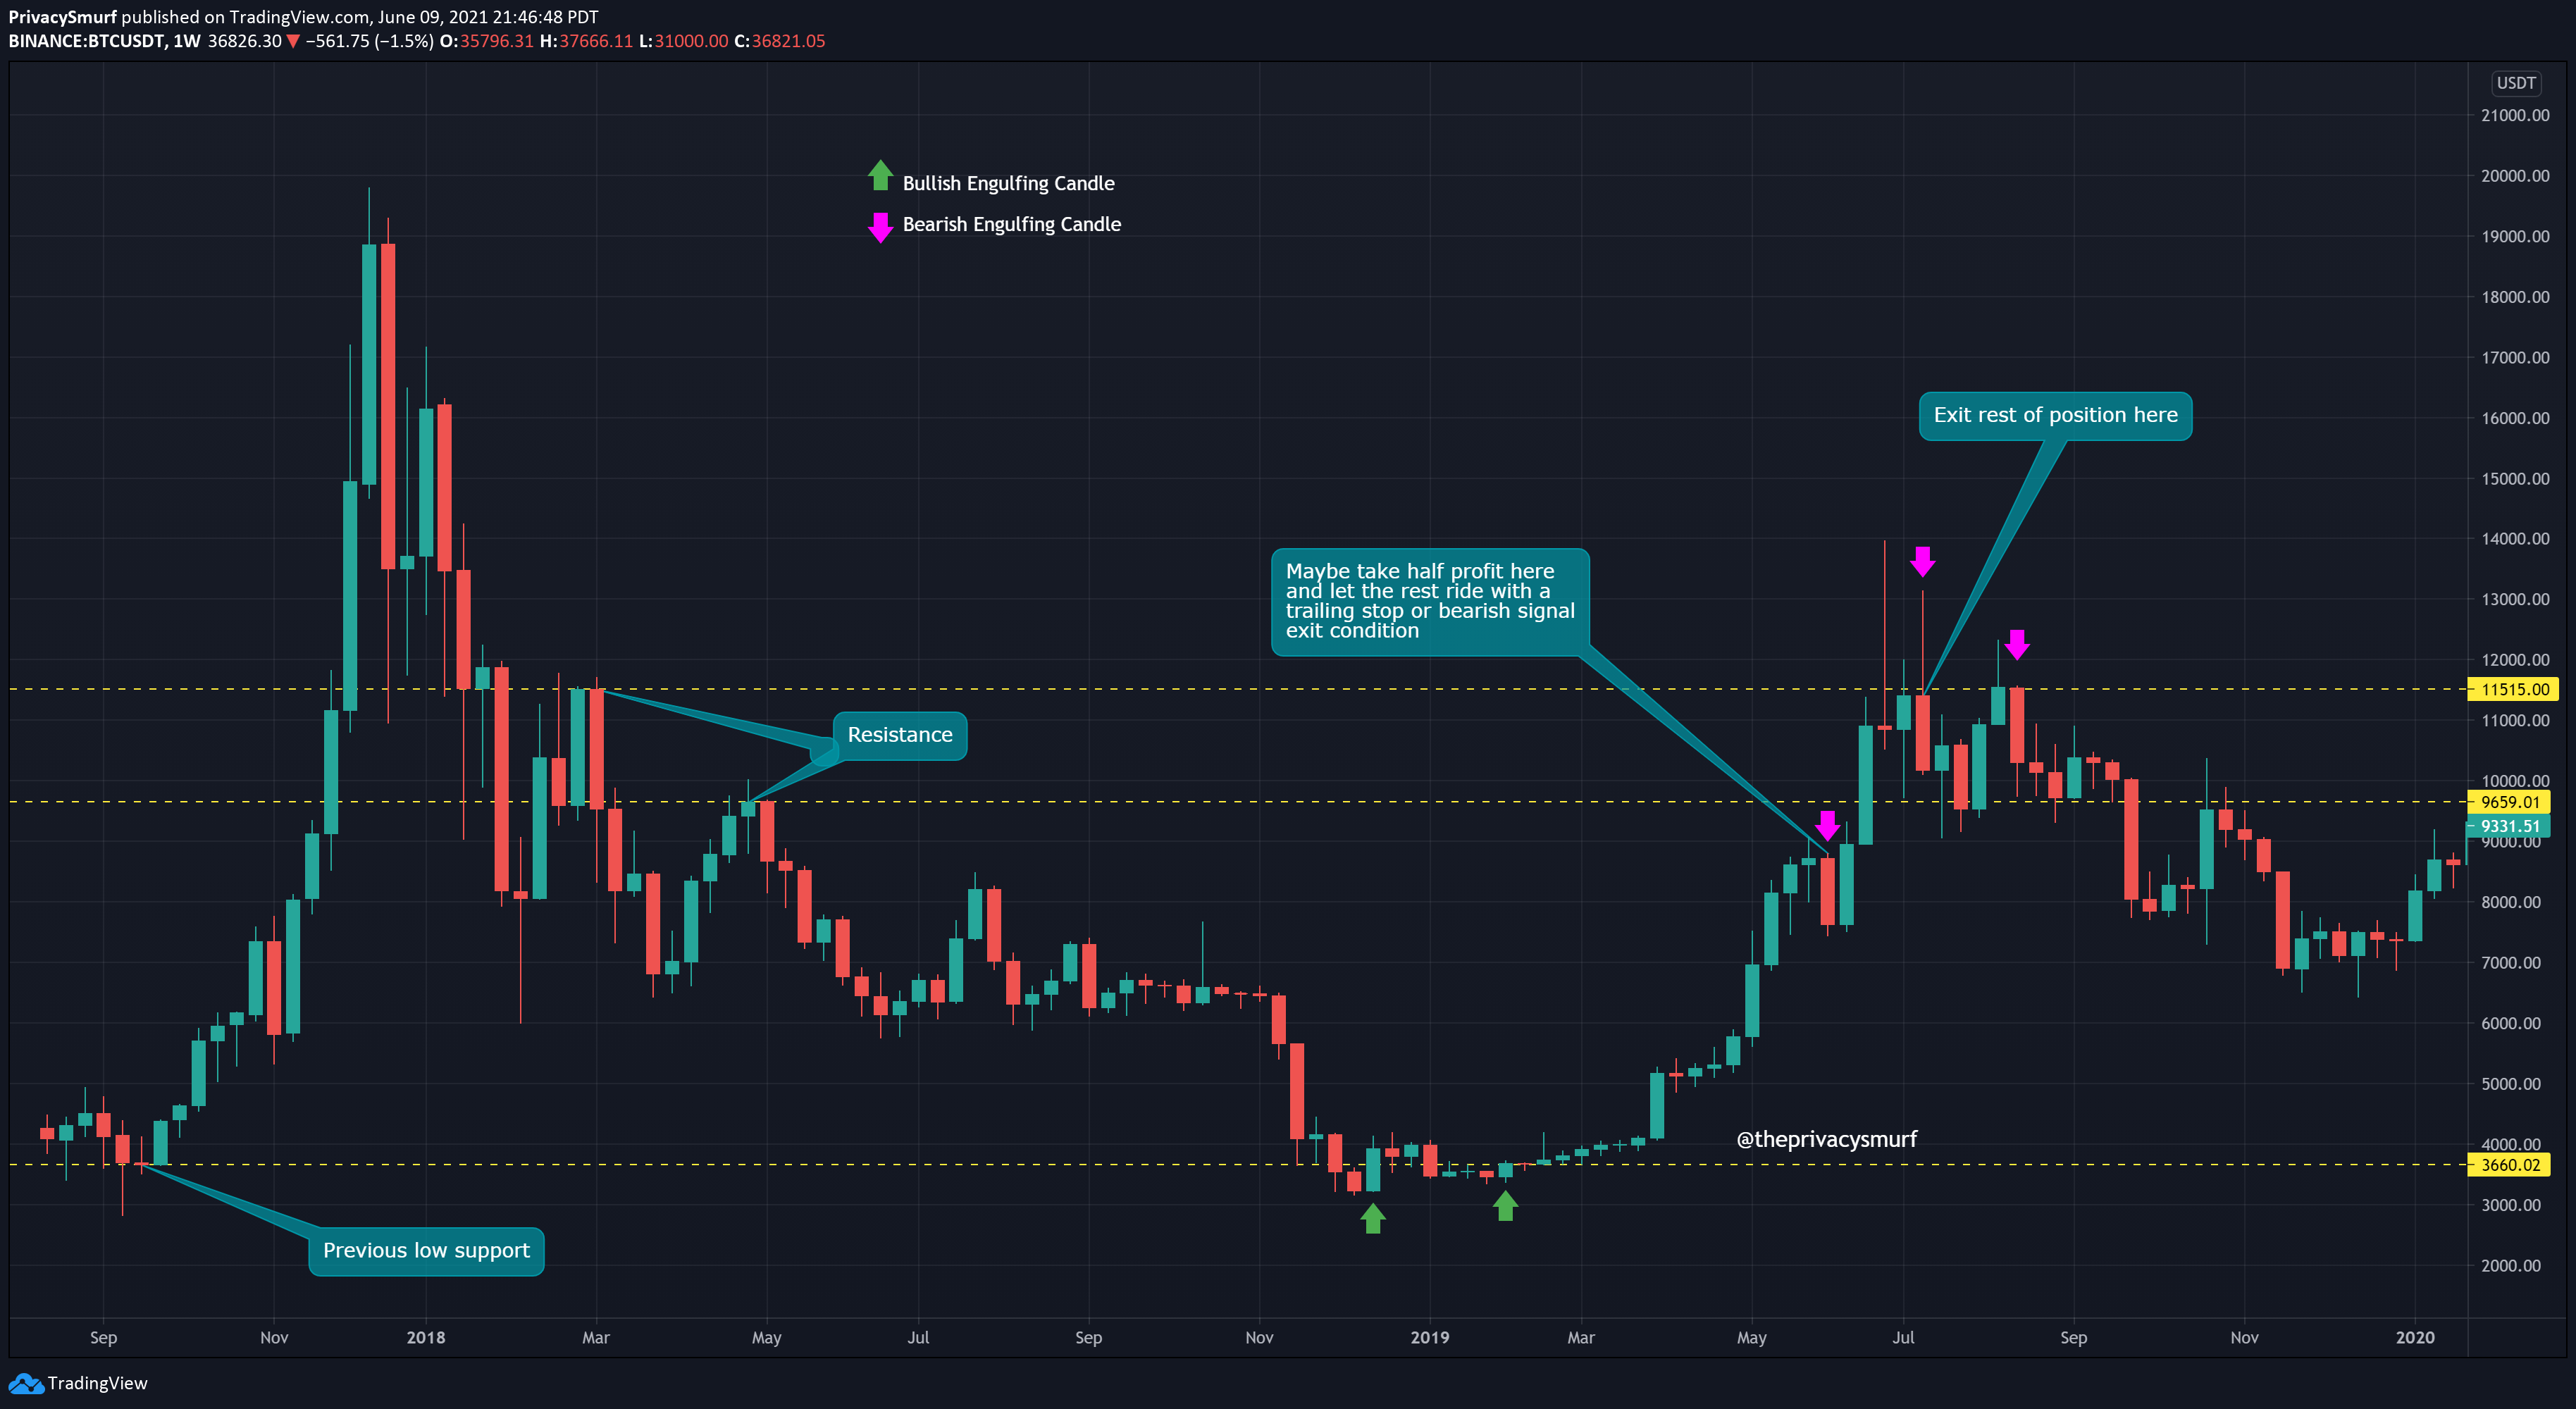
In liquid cryptocurrency assets, often you won’t have an instance where the close of the first body is different than the open of the first but that’s ok, it’s still valid. Engulfing candles when they appear at support are highly probable indications of price reversal. Below is BTC on the weekly chart using bullish and bearish engulfing candles to time what turns out to be a very profitable investment.
Below is KAVA on the 1HR timeframe. There are multiple intraday opportunities to make trades using engulfing candles at support and resistance. Profits will be smaller and trades will be more frequent. One way to increase the profit potential is to search through coins that have larger gaps between support and resistance.

Takeaway: Engulfing candles have a higher probability of indicating reversals than many other price action candle patterns.
Trend continuation is also something you can identify with a higher level of probability using certain candlestick patterns. The Hammer candle can identify bullish trend continuation. The inverse of this candle formation the Shooting Star can identify bearish trend continuation. Here is a handy graphic portraying each pattern.


The stats on these SINGLE candle formations for indicating a reversal aren’t within boundaries I prefer to trade but indicating trend continuation they are. Below are a couple of examples of Hammers on the BTC daily chart.

Dropping down to the 4HR would again see more options for potential trades but the accuracy will decrease. It’s still in line with my parameters though as you get many many more setups. See below how the hammers on the charts were poor indicators of the reversal of the bearish trend.

Takeaway: The Hammer and Shooting Star candlesticks are good trend continuation signals. One handy trick to objectively measure the candle bodies is the fib retracement tool. If verifying a potential hammer apply the fib retracement from high to low. If measuring a potential shooting star apply the fib retracement from low to high. If the candle body is contained between the 1 & .618 it’s valid.

HONORABLE MENTIONS
The first price action setup I ever learned is the Inside Bar and it’s got a really great win rate if used correctly, especially on a daily chart. Here’s what an inside bar setup looks like.

That’s it. Pretty simple right? The usage is just as easy. If the next candle closes above the 1st bar high a long position would be entered. Alternatively, if the next candle closes below the 1st bar low a short position would be entered. The exit condition would be the first profitable close. These are typically closed in one or two bars. It’s a quick in and out capitalizing on a price action pop from a brief period of consolidation. Different exit conditions can be tested and tweaked but it’s not really necessary. I used this often in my time trading metal markets and Russell futures early on. Here are a few examples.

To add some complexity to the hammer and shooting star using them as a TWO candle setup dramatically increases the effectiveness at predicting a potential price reversal. I’m not gonna go too much into it because it’s applied very similarly to the bullish and bearish engulfing candles. Here’s a graphic of what the pattern would look like though. Just like the single hammer and star candles the single candle directionality doesn’t make much difference. The importance lies in the presence of the large wicks indicating strong and consistent bullish or bearish pressure.

We’ll wrap things up with what I feel is an underrated pattern. The Doji. This candle is a huge blip on my radar when I’m in positions. It shows indecision. It shows a struggle. This candle represents a deadlock in the struggle for control of the price. I always monitor price action directly following this if I’m actively trading. There will often be opportunities after.

That’s all I’ve got for today but it’s plenty of stuff to look into on your own charts for testing and experimentation. Going through and annotating support and resistance on your favorite coins and setting price alerts to them is a great way to find potential trades. An alert goes off when the price touches the line and all that needs to be done is to flip to the chart and watch the candle close to see if any of the above patterns appear while you create a trading plan for exiting and a stop loss.
For Showcase Saturday please comment on the Altcoins you’d wanna see analysis on and the top picks will be featured.
Thanks,
@theprivacysmurf
I don’t know that I understand most of this yet ; but do ask if the section on engolfing candles is completely correct or if possible error there? As don’t see that 2nd is bigger or the part about “ won’t have an instance where the close of the first body is different than the open of the first “ ?? Is this correctly written Terry sir?
Hey Terry, related to the Engulfing candle formation, I see multiple candles that look like bullish Engulfing candles, but are not called out. Is this because you focus on those closest to support and resistance?