

Sunday Synopsis #44: Down & Out
Sunday Synopsis #44: Down & Out
They say he (down, down). They say he (down, but not out). 'Cause I'm back on my grind, money back on my mind.

What a week! Mainstream media is all over the death of crypto and the blood in the streets. It’s annoying at times but it’s also often a sign of the bottom on the horizon. BTC is ‘down, but not out’ and it’s a time to be extra cautious and smart about your choices. There are plenty of opportunities for risk and just as many for ruin in these conditions. This is why I try to bring you the objective analysis as free from bias as I can possibly make it. Let’s get into it.
NSFW lyrics…. so consider yourself warned.
BTC/USDT Weekly Structure
https://www.tradingview.com/chart/4v8qizyI/

This week BTC continued the bearish price action setting a new lower close. The fib retracement from the highest high of the last ‘Confirmed Market Structure’ resistance is extended to the new low at $17622. This week’s close is the new ‘Unconfirmed Structure’. If prices increase from here with at least two green candles and a close above $29298 this will confirm the structure as support. The weekly market structure trend is still bearish. From a long-term perspective, there are no moves to be made at the moment since the ‘meaningful retracement’ at $18185 from Dec 2021 has been hit and is holding at the moment as support with no closes below to invalidate it. Last week I expressed that I had a long-term DCA buy order there (that was in no way an attempt to time the market or call a bottom but is a location of value). With price responding up from there so far this has shown to be an ideal location for the purchase of long-term holdings. The next DCA location is much lower at $10256. I don’t have any expectations of that to be hit in the near future given current technicals, but I do have a DCA order there.
BTC/USDT Daily Chart
https://www.tradingview.com/chart/jjSdFW4b/
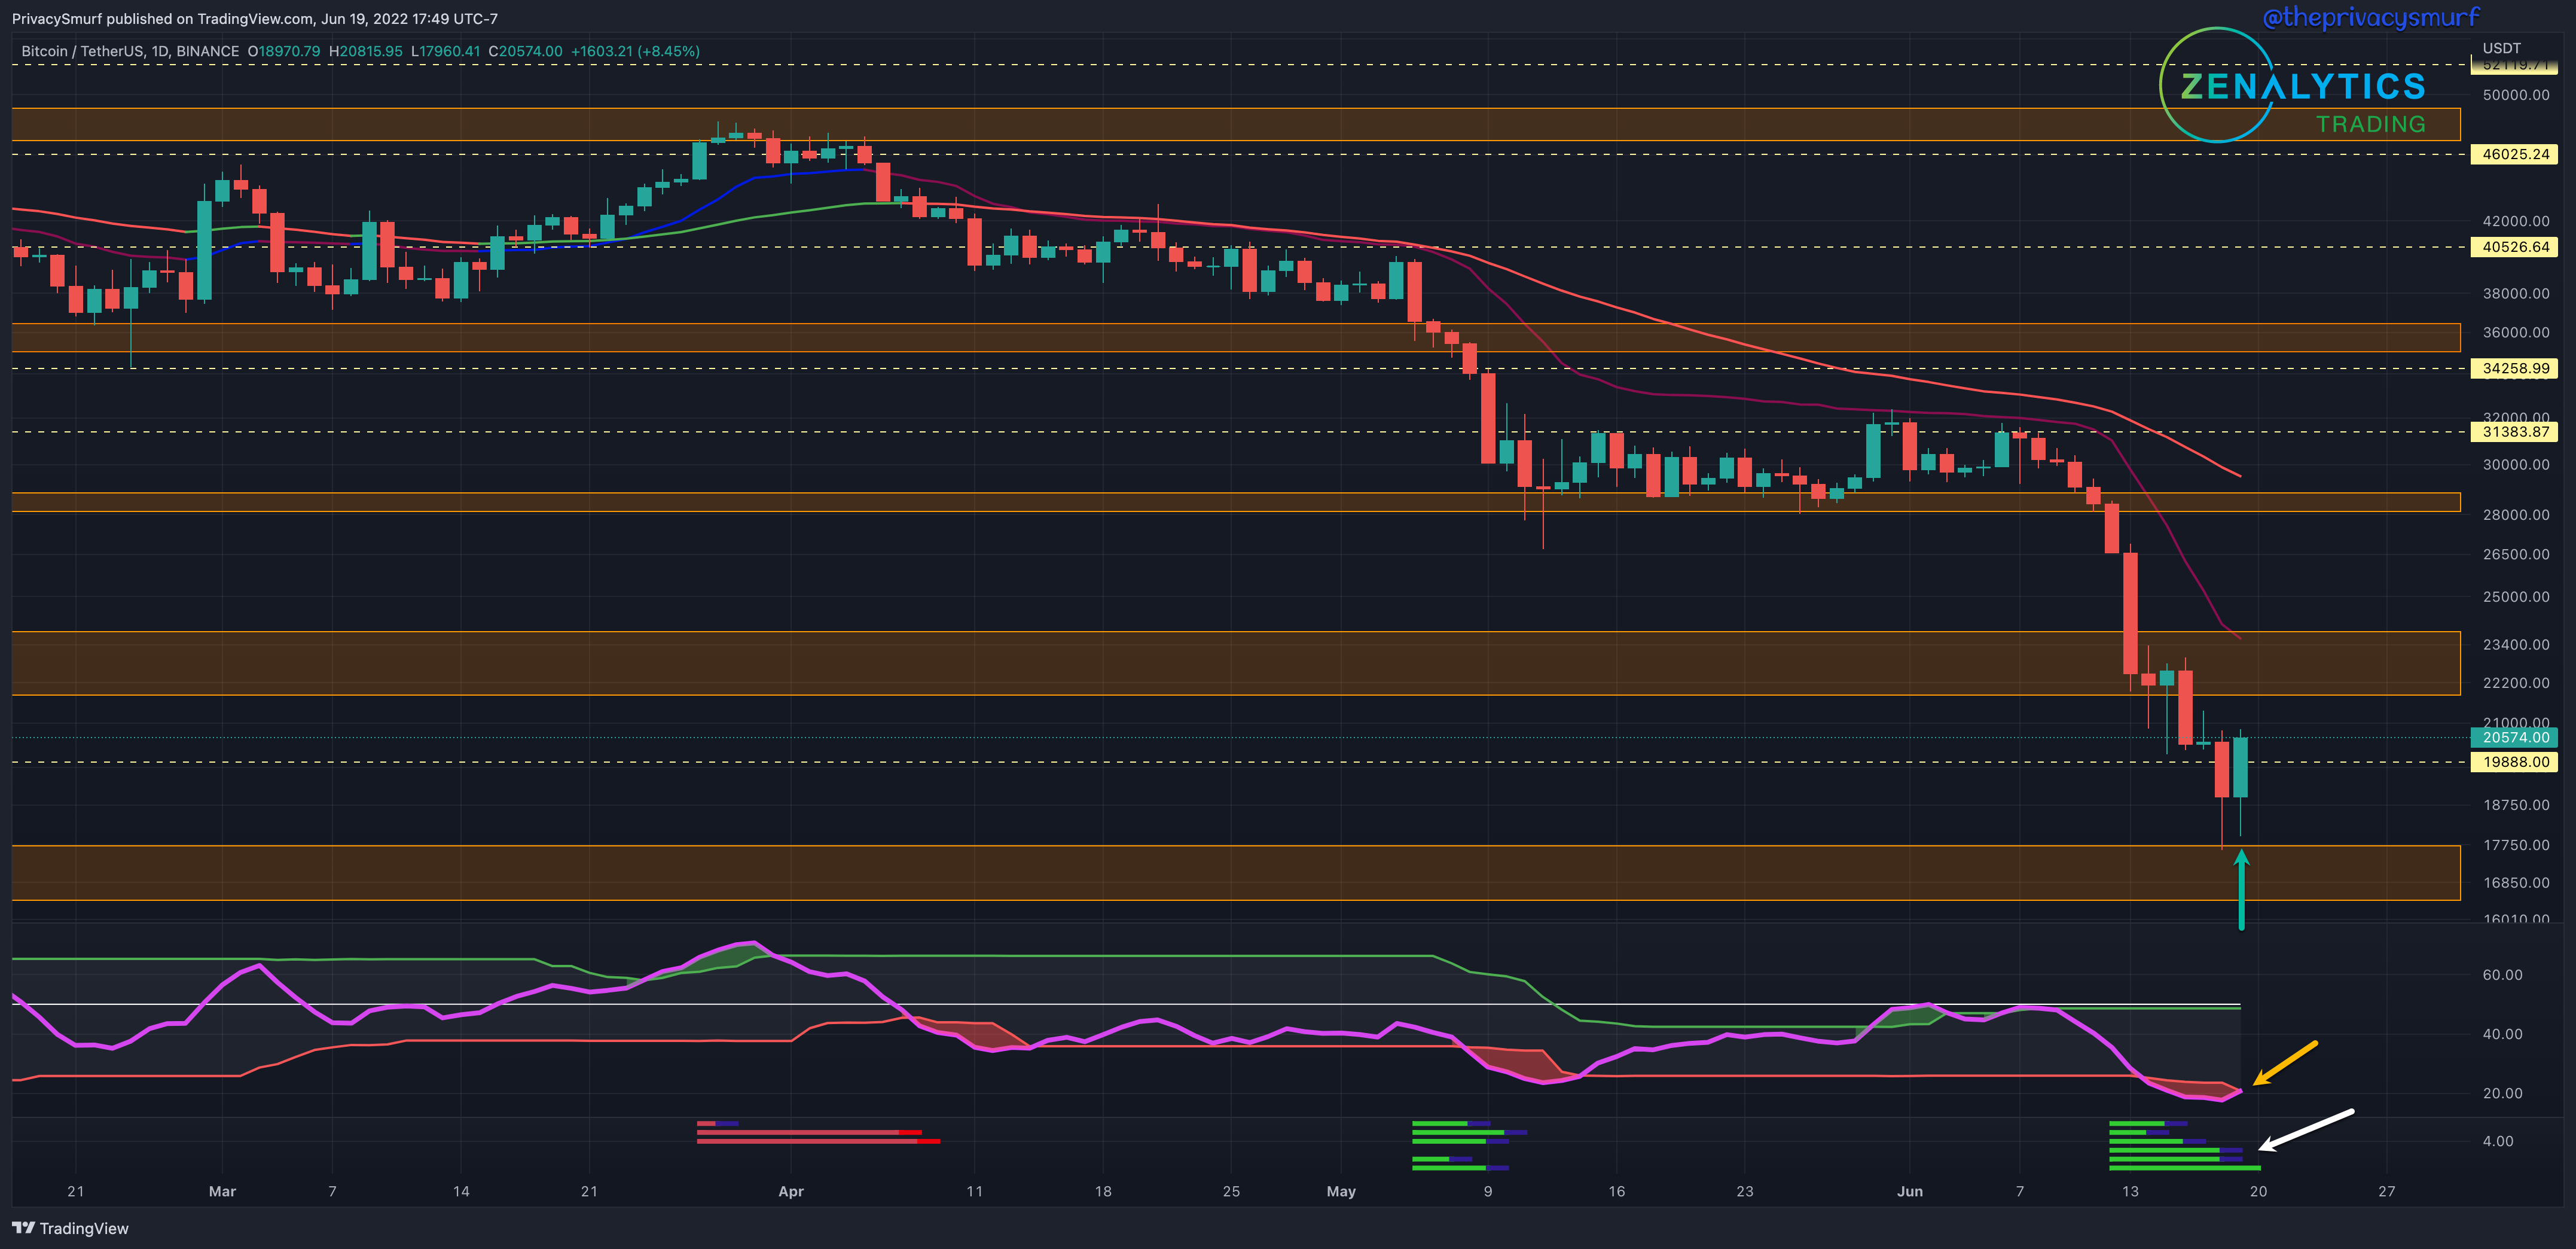
Last week the choice to be hesitant to call bottoms was a wise one as the ‘bottom’ fell out and touched the lower support zone. The trend is very much still bearish so I’m not expecting a full trend flip but there is a case to be made for bullishness early in the week. Sunday closed as a bullish engulfing candle (green arrow) which is my favorite bullish candle pattern (you can see more here). The RSI is curling back into the bands from the excursion under the bottom band. This typically is represented in price action as an exhaustion of the downside volatility. One note of concern is still my custom indicator on the bottom, the Correction Strength Meter (white arrow). The blue marks at the end of the green lines signify the invalidation of the bullish divergences on price action oscillators. Only one remains in bullish divergence (the OG, Momentum). This invalidation would suggest a bearish price continuation. It is certainly something to keep monitoring. In the bullish case, while optimistic, there are plenty of resistances. First of which will likely come in around $23.5k. Not selling off from there would be a very bullish sign for the short term.
ETH/BTC Weekly Structure
https://www.tradingview.com/chart/sacHlXOv/
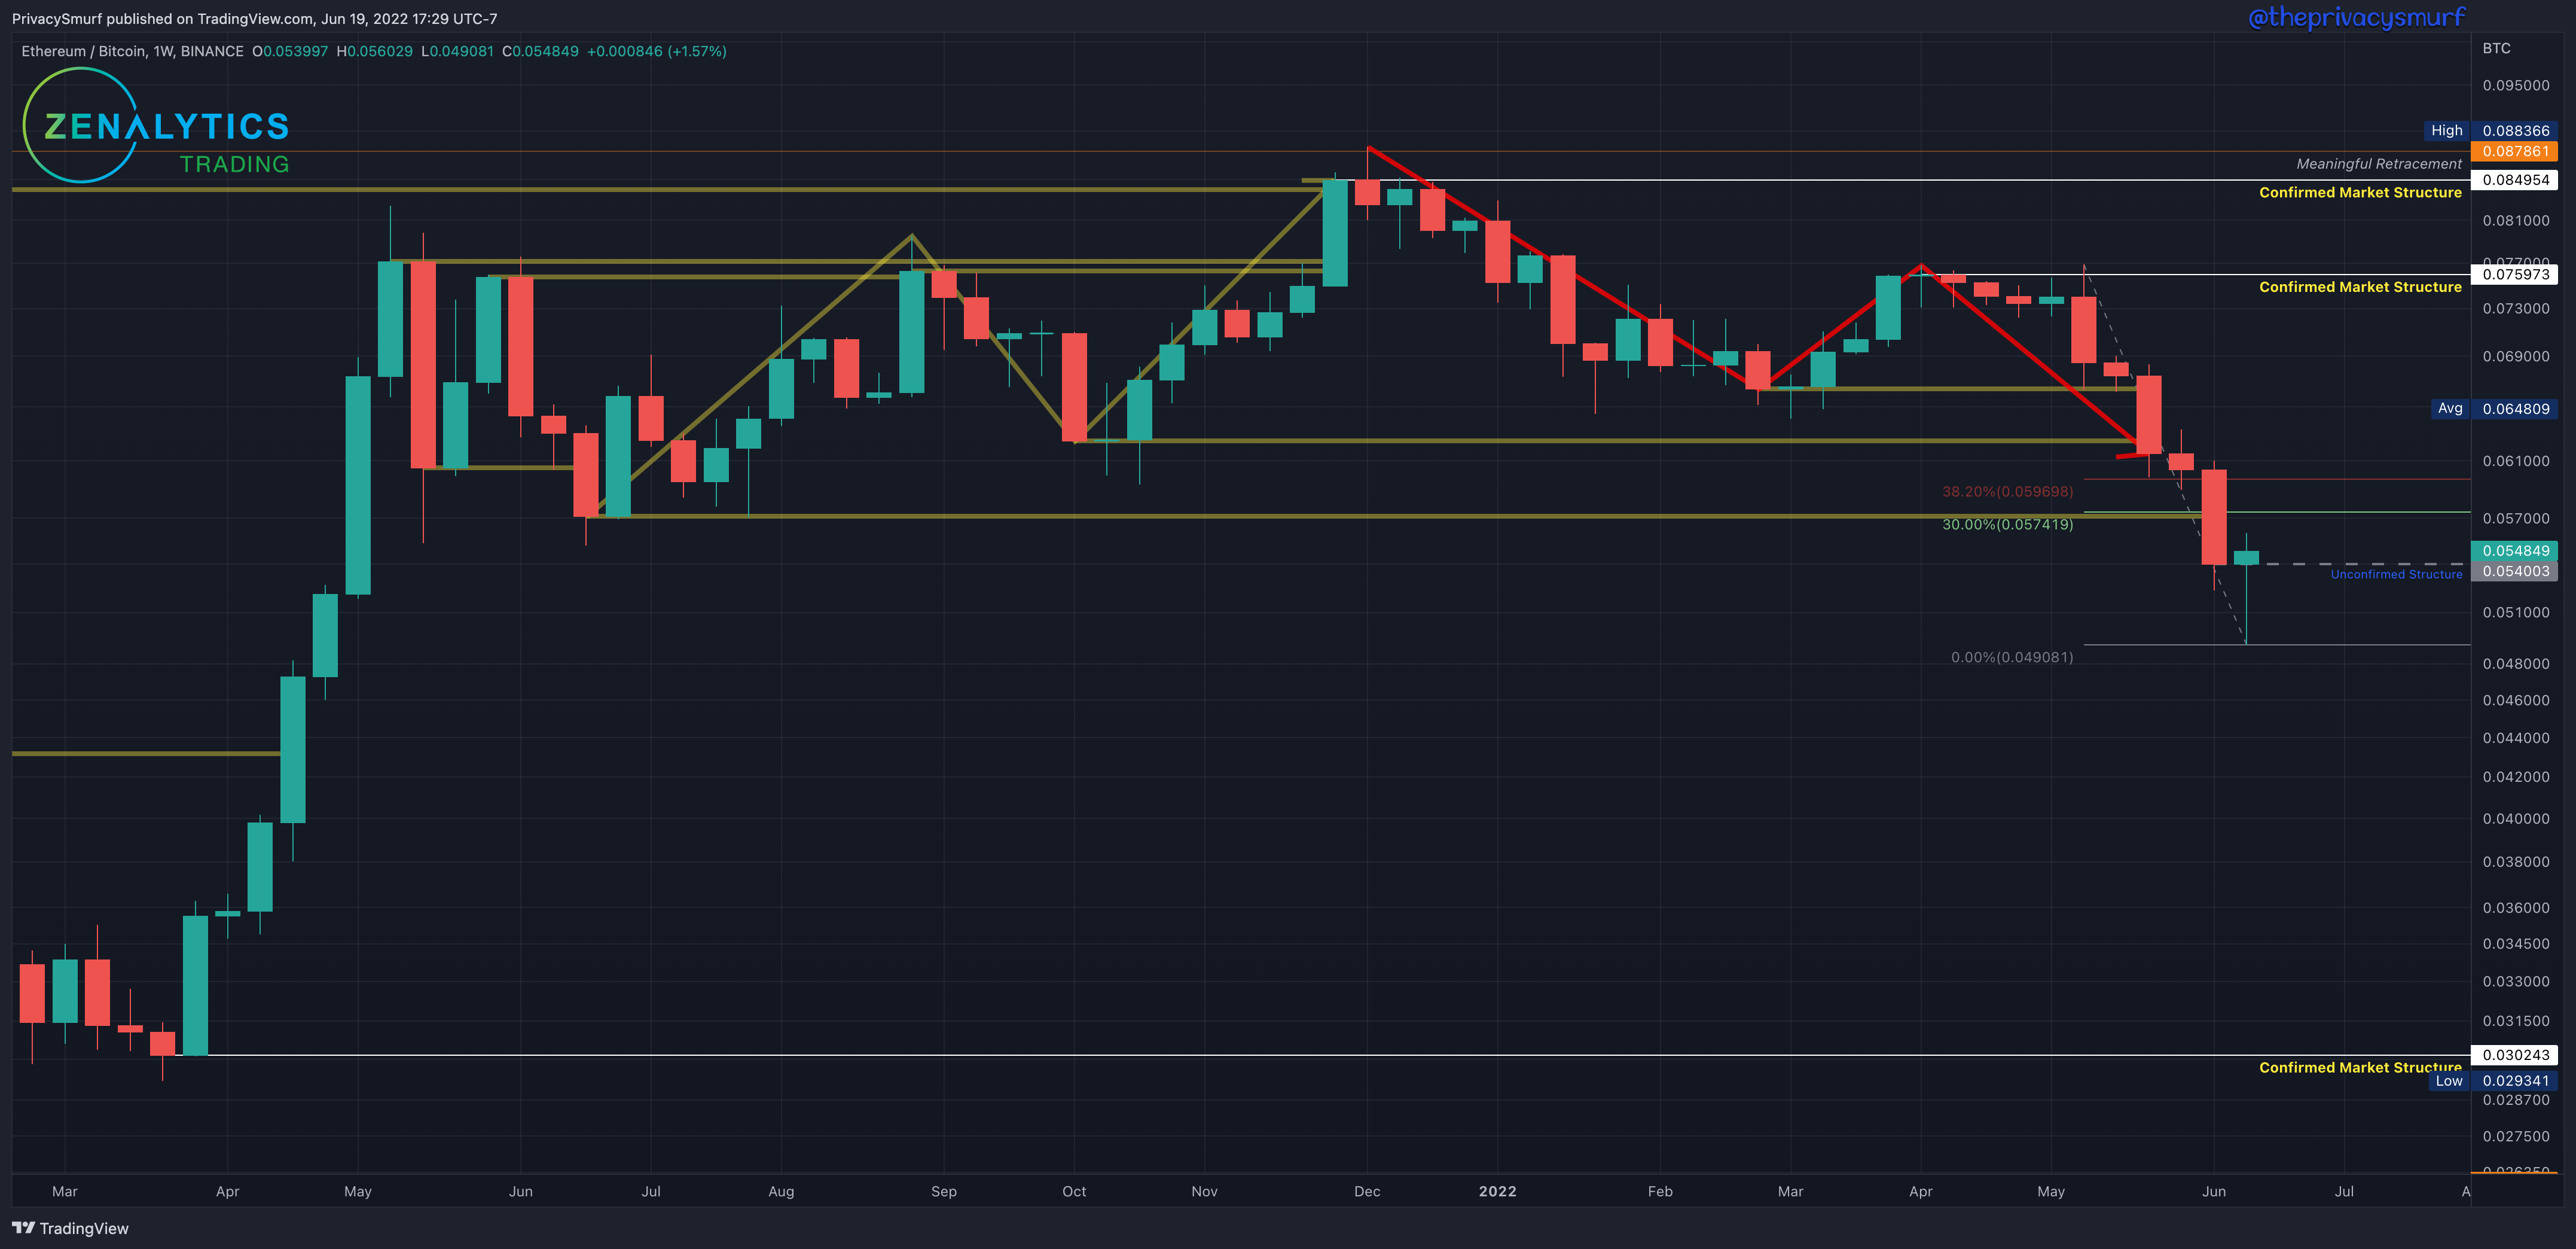
This week we see ETH/BTC closing as a bullish hammer candle. Since the candle printed new lower lows the fib retracement from the highest high of the last ‘Confirmed Market Structure’ resistance to the new low at 0.049081. The ‘Unconfirmed Structure’ location remains unchanged since there is not a new lower close this week. If prices increase from here with one more green candle and a close above 0.059698 this will confirm the structure as support. The weekly market structure trend is still bearish. From a long-term perspective, there are no moves to be made at the moment. The next market structure is at 0.030243 with the possibility to act as support. I expect that if we continue to lose value in the ETH/BTC relationship the last broken support at just under 0.044 will act as support. I have a long-term DCA buy there (it is in no way an attempt to time the market or call a bottom but is a location of value).
ETH/BTC Daily Structure
https://www.tradingview.com/chart/gTkSjkj6/

From last week:
“Price is making a new low while the RSI is not at a new low...This can often lead to a reversal… It is something to keep an eye on in the near term. I am hesitant to expect ranges at the moment as we are likely to see lots of volatility…”
Volatility was in full effect with multiple up and down days. The trend is very much still bearish so I’m not expecting a full trend flip but there is a case to be made for bullishness this week. Sunday closed as a bullish engulfing candle (green arrow) and also as a new higher high close breaking above the closes earlier in the week. The RSI is well inside the bands and trending towards a top band break. This break typically is represented in upwards volatile price action outside of normal recent fluctuations. The Correction Strength Meter (white arrow) at the bottom is showing bullish trade signals. The first targets sit around 0.062 (purple arrow) which is also a dynamic resistance at the 50-Day EMA. I’d expect resistance there if ETH gains on BTC. This action may also translate into some altcoins gaining as well but it’s an extremely risky time to be buying into altcoins. It should be reserved for altcoins with high conviction and only spot buys. Leveraged positions are still a high risk since the trend is still down.
ETH/USDT Weekly Structure
https://www.tradingview.com/chart/JPTp0aXw/
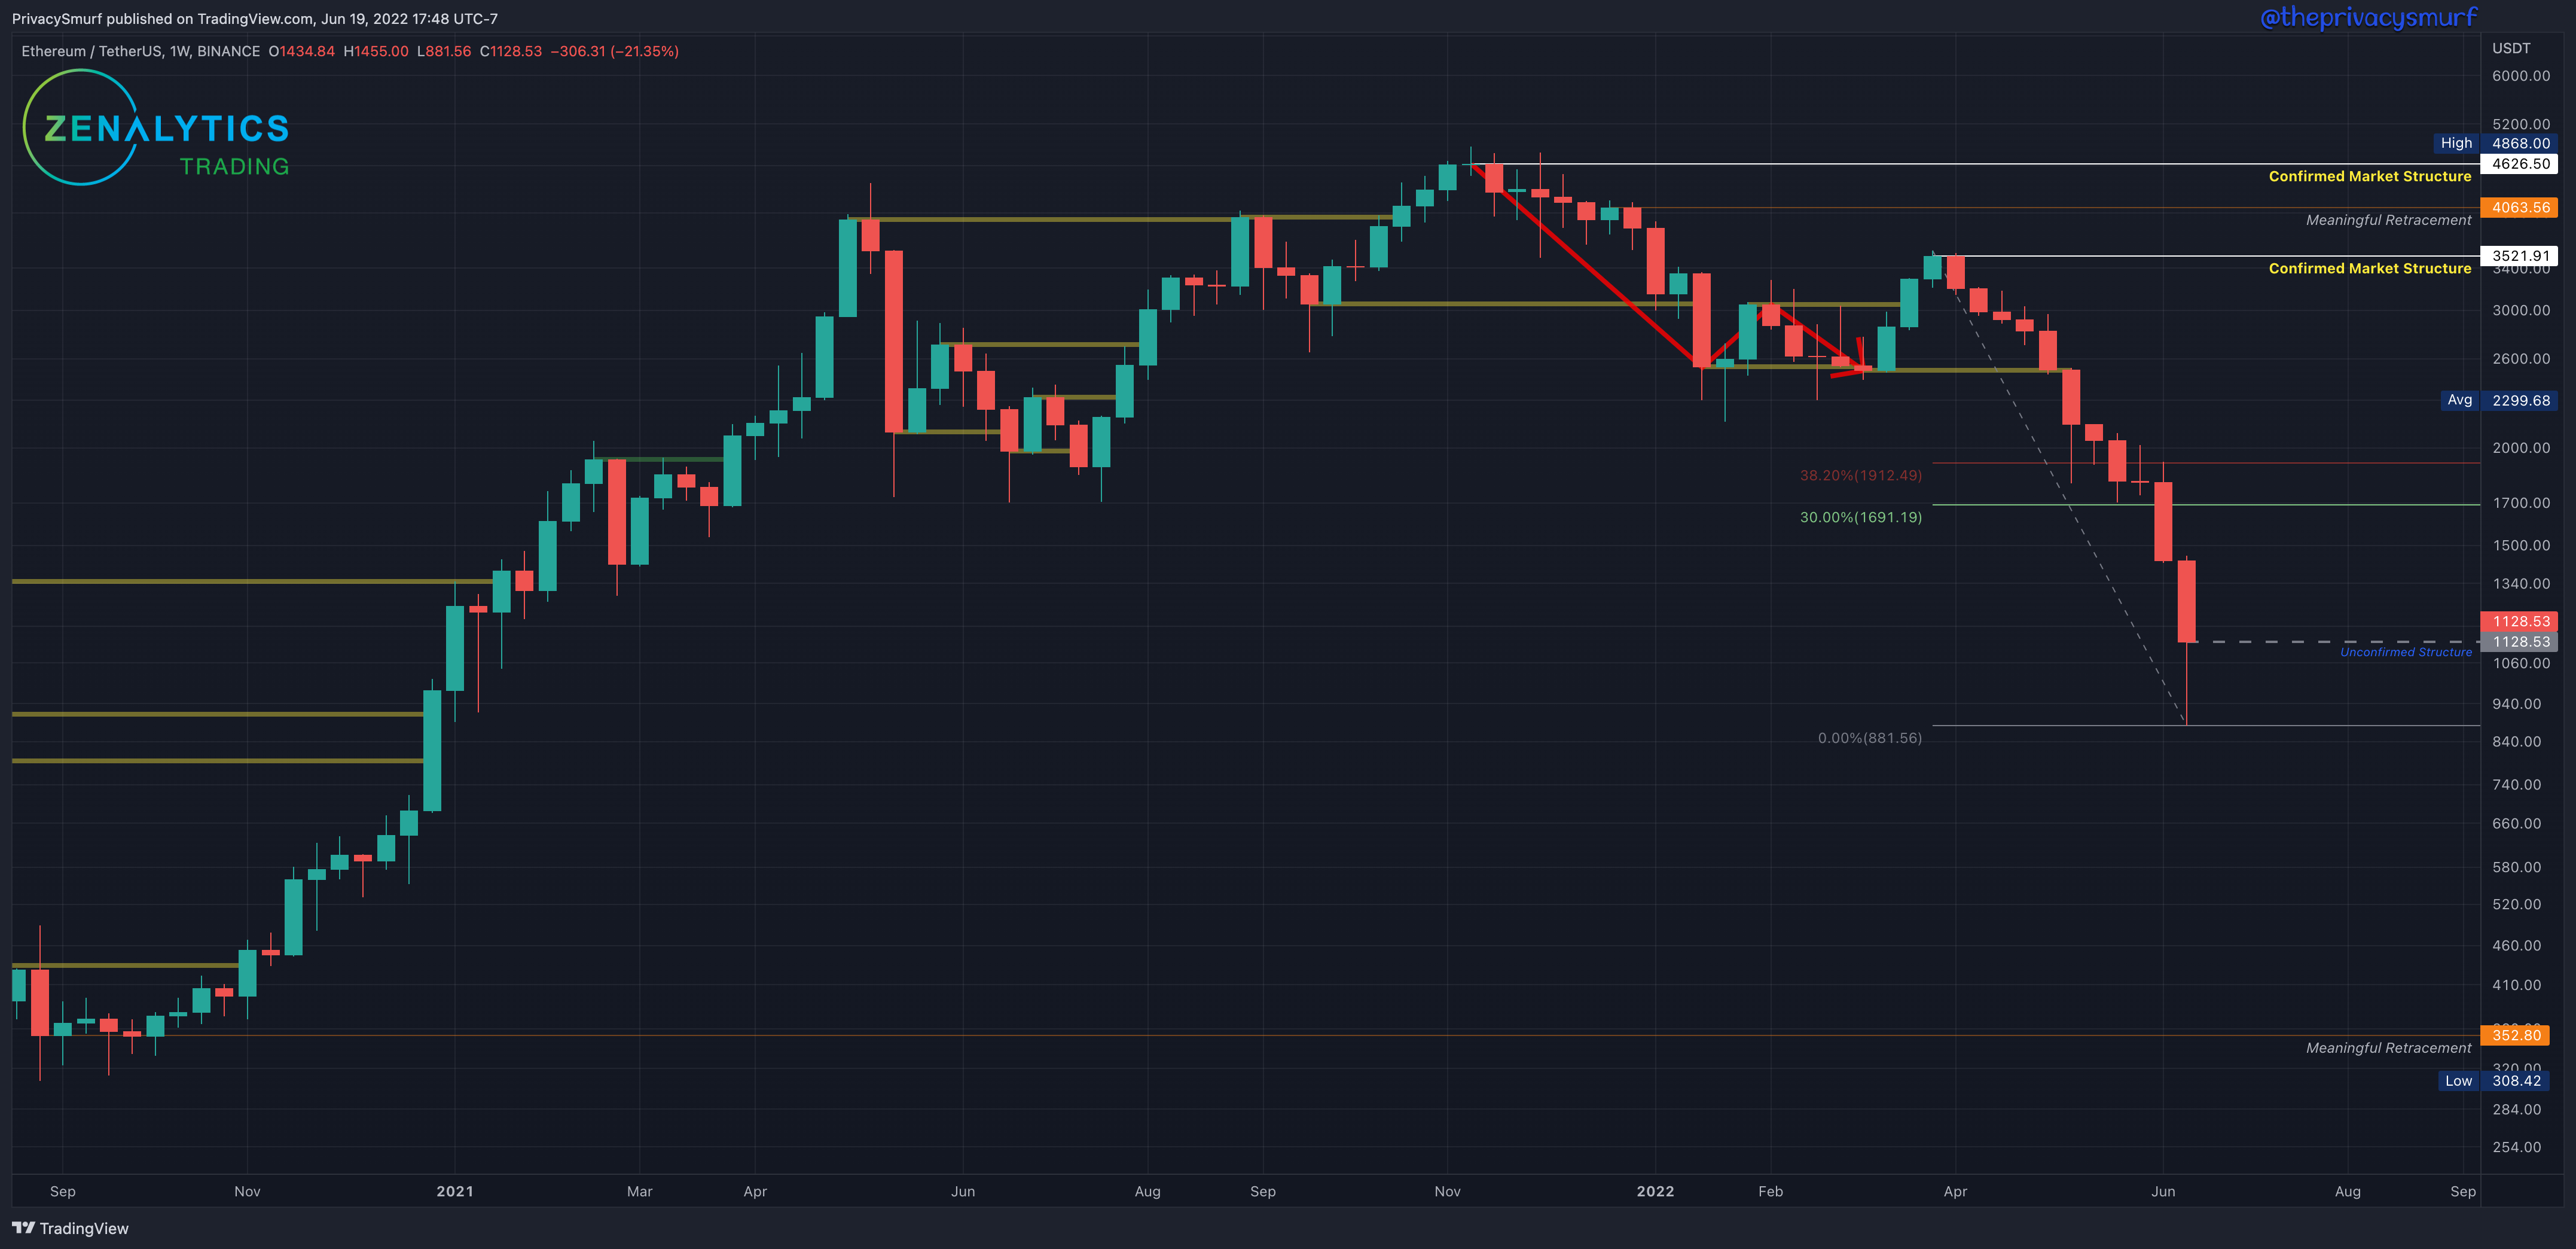
Similar to BTC, this week ETH continued the bearish price action setting a new lower close. The fib retracement from the highest high of the last ‘Confirmed Market Structure’ resistance is extended to the new low at $881. This week’s close is the new ‘Unconfirmed Structure’. If prices increase from here with at least two green candles and a close above $2247 this will confirm the structure as support. The weekly market structure trend is still bearish. From a long-term perspective, there are no moves to be made at the moment. Last week I expressed that I had a long-term DCA buy order at @$1232. Prices fell much harder than BTC and remain underneath that level. This is why I stress that DCA-ing is “in no way an attempt to time the market or call a bottom”. It is a location that has shown as valuable to buyers. That may not be true further into the future. Dollar-Cost Averaging is a means to take thoughts, emotions, and timing out of your purchases and make them mechanical and simple. Long-term it is typically more cost-effective and profitable than trying to always time the markets. The next DCA location is much lower at $352. Given current technicals, I don’t expect that to be hit in the near future, but I have a DCA order there.
ETH/USDT Daily Structure
https://www.tradingview.com/chart/xbB6lkZu/
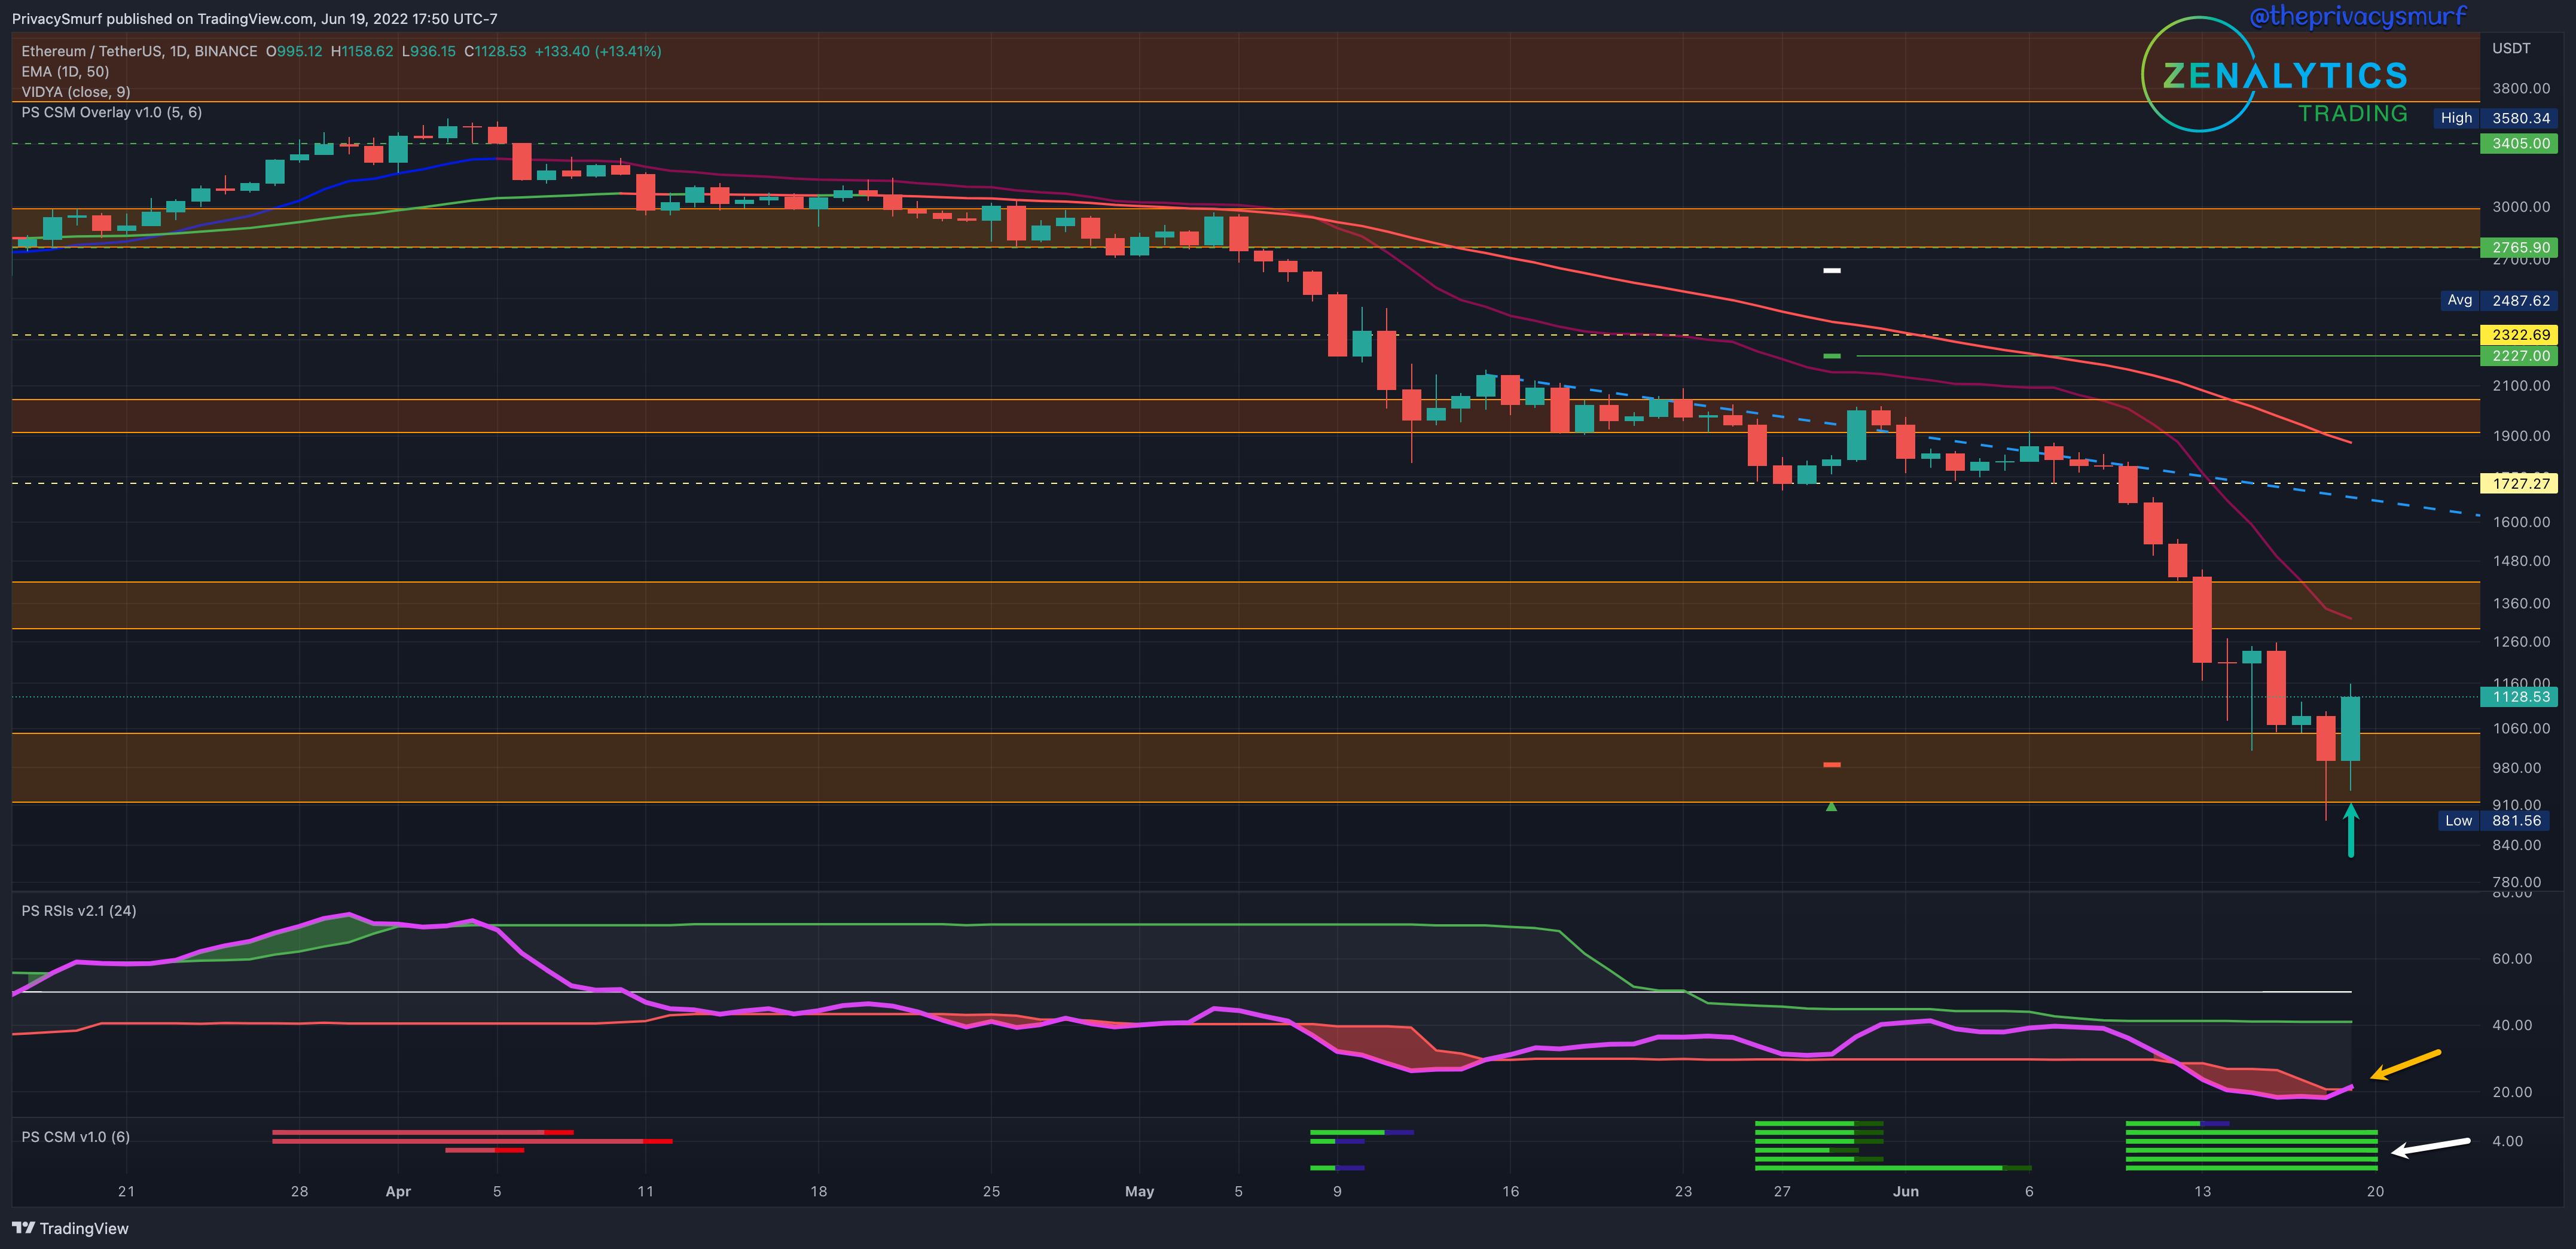
Same as BTC, last week the choice to be hesitant to call bottoms was the right call. The low support zone is still holding for the moment with only wicks below. The trend is very much still bearish so I’m not expecting a full trend flip but there is a case to be made for bullishness early in the week. Sunday closed as a bullish engulfing candle (green arrow). The RSI is curling back into the bands from below which as explained below is often shows a slowing in the immediate downtrend. The Correction Strength Meter (white arrow at the bottoms remains in bullish setups minus one invalidation. This is a higher bullish case for ETH than BTC, which is mirrored by the strength in the ETH/BTC chart. It’s possible that some ETH and altcoin strength catches folks by surprise. I’m seeing a lot of talk around the interwebs about BTC Dominance and how alts are gonna get wrecked vs BTC. While that’s commonly true it’s not always the case and monitoring ALT/BTC charts is really important. I have this great post about alternate pairings (HERE) and another about how to really look at the concept of BTC Dominance (HERE). I’m not going to get into it in this post, you should really read the second post but TLDR: Mid Caps are currently outperforming BTC. In the bullish case, while optimistic, there are plenty of resistances. First of which will likely come in around $1400. Not selling off from there would be a very bullish sign for the short term.
It was a really rough week. I hope everyone fared well. I’ve been trying to post out more of the prior weeks’ links to spread the word on my products and stress the accuracy provided here to help folks not get wrecked and help them learn how to be more profitable. I appreciate every share and reply and comment! See you in a few days with some more intraday trading ranges. Things are getting good on smaller timeframes, for all you day traders out there.
@theprivacysmurf
Can you please post again your long term cycle chart?? Tks a lot, Maurizio