

Sunday Synopsis #11
Sunday Synopsis #11
All of which makes me anxious At times, unbearably so.


Double post tonight. Lucky you. :-) Gonna try to make this one pretty succinct since I just put out a pretty wordy post.
Starting off with the weekly update on BTC we can see that the bulls are still in the house despite it being a red week. The 49k resistance is still holding up though. I’d expect weekly support levels to start around $47K if the bulls can’t keep things moving up.
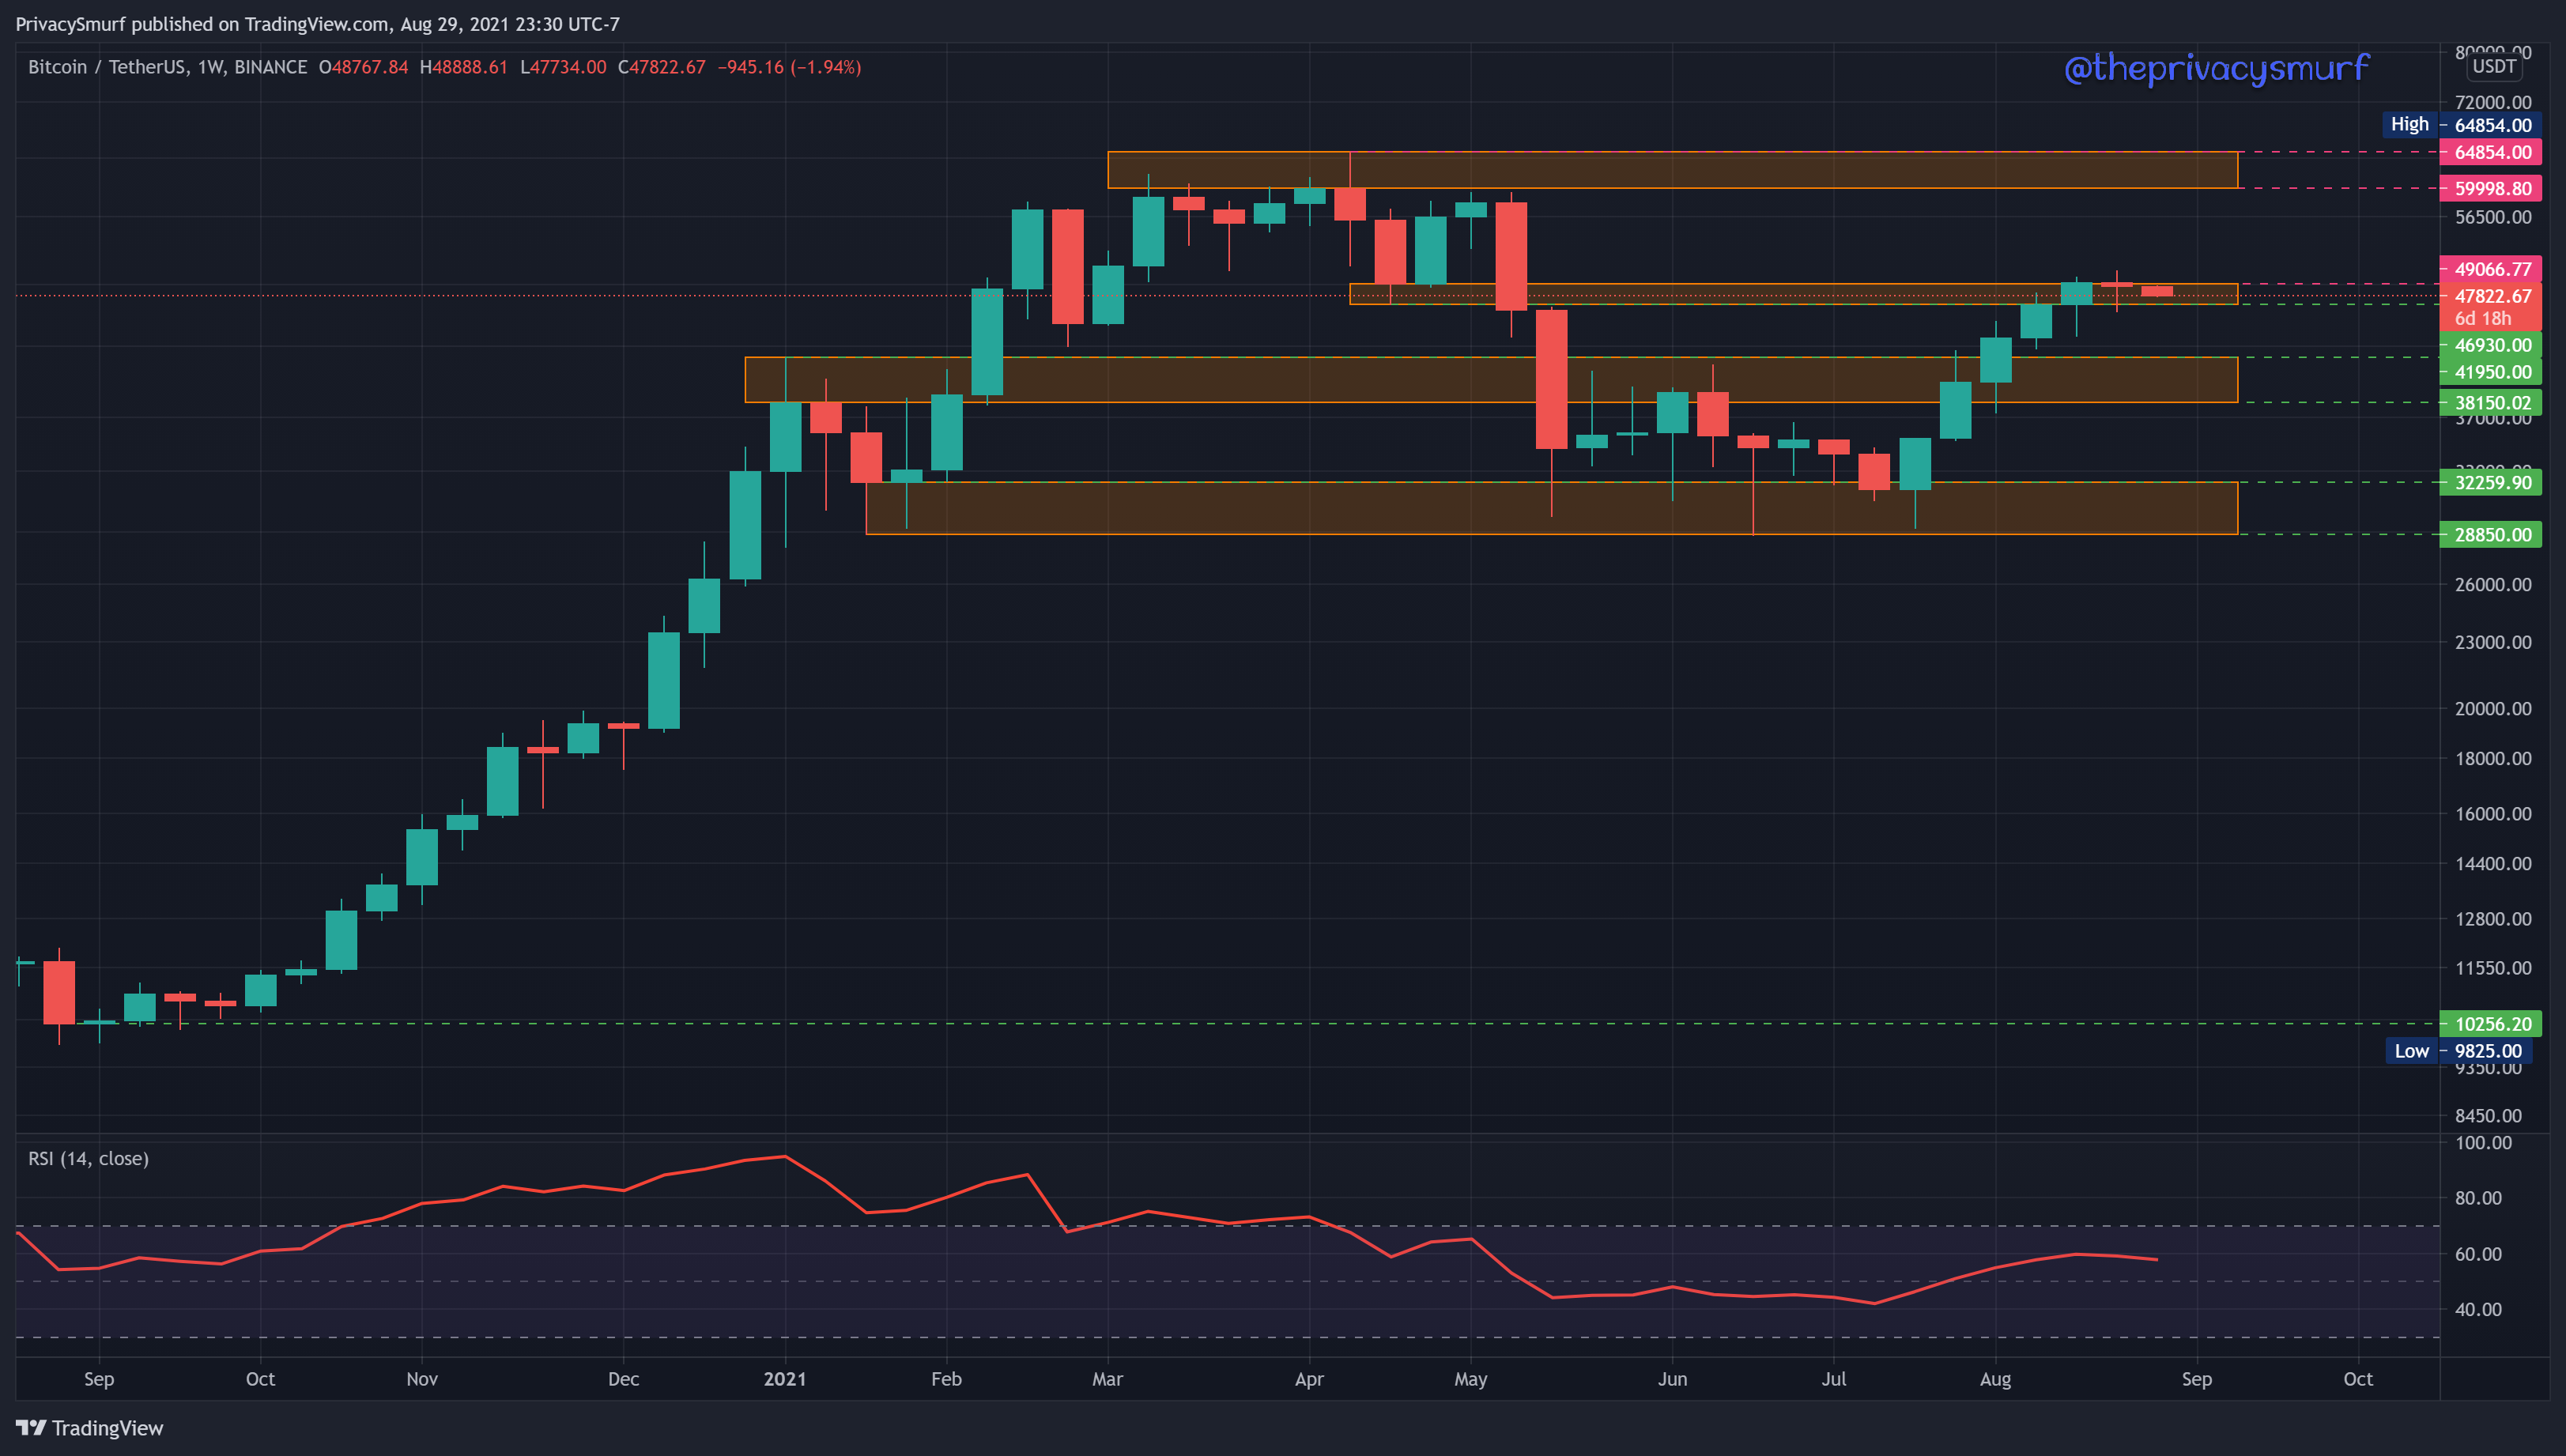
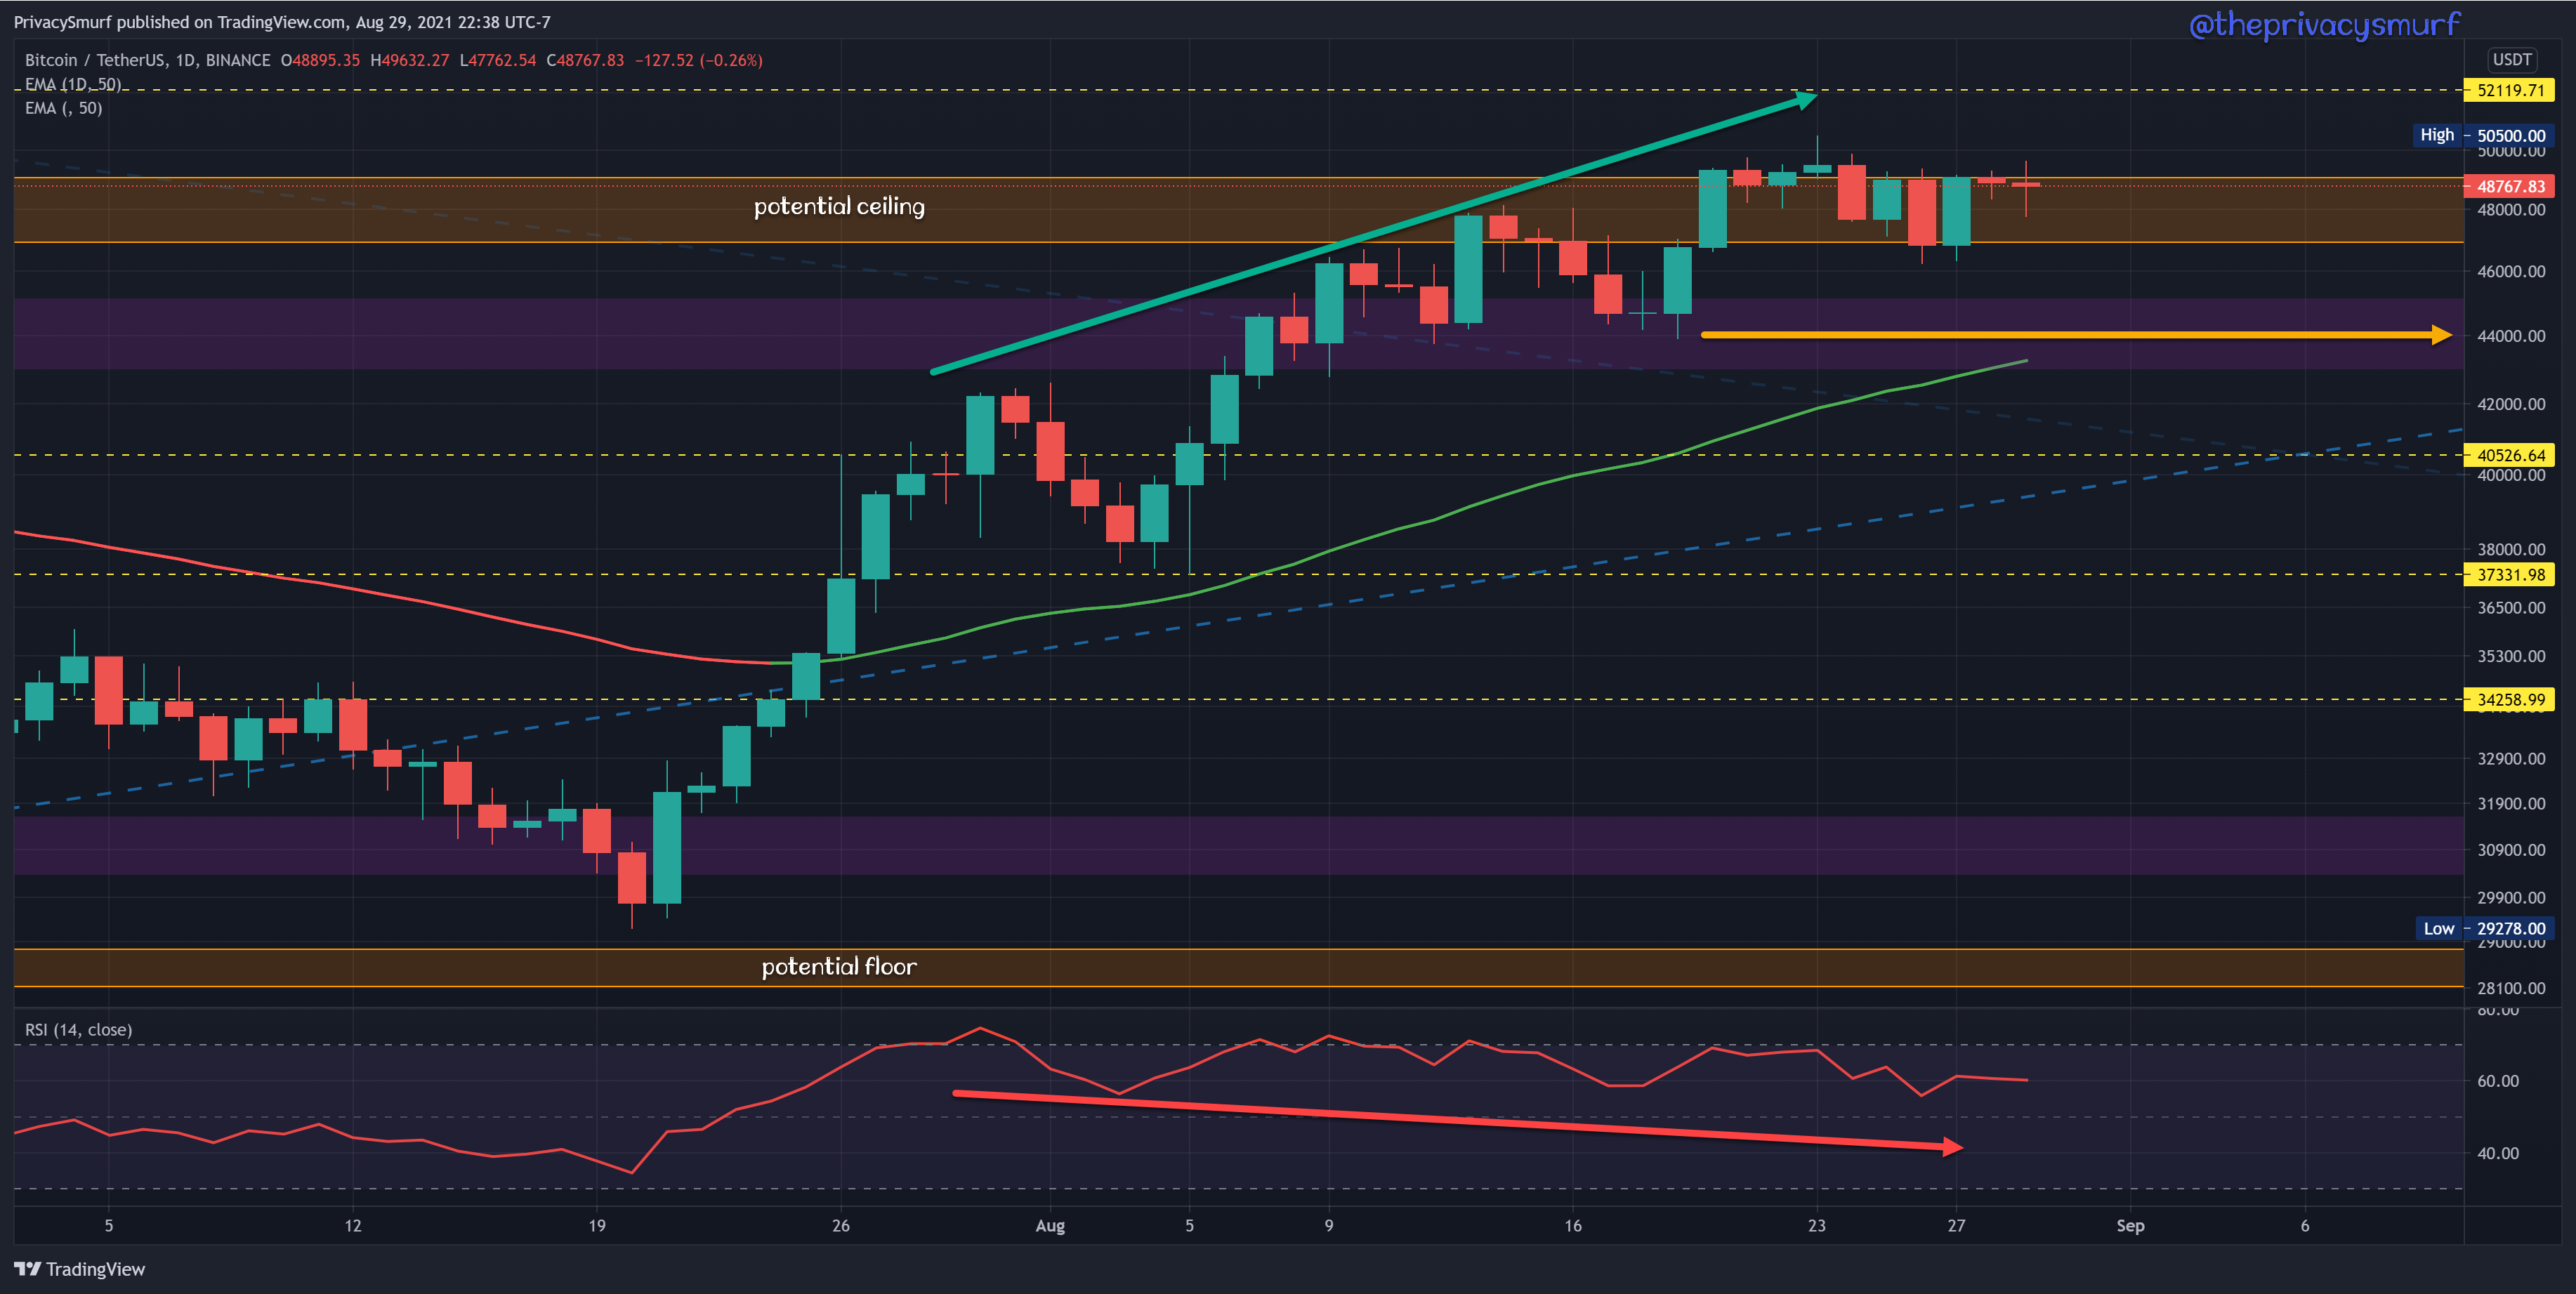
The bearish divergence caused by increasing prices and decreasing RSI measurements from last week is less prevalent as the RSI is starting to fall in line with prices. The RSI is still steadily declining though so without an inflow of buy volume I’d expect lower prices in the week ahead. Buyers appear to be happy with scooping up BTC at $44K. I think that will be strong support as well because it will have the added backing of the 50-Day EMA. If that exponential moving average fails to hold the next lower historic horizontal support level is at 40.4K, but at the moment I imagine a test at the EMA will be in line with the midline of the RSI so I’d be watching for a bullish candle pattern around that zone to take a short-term long position.
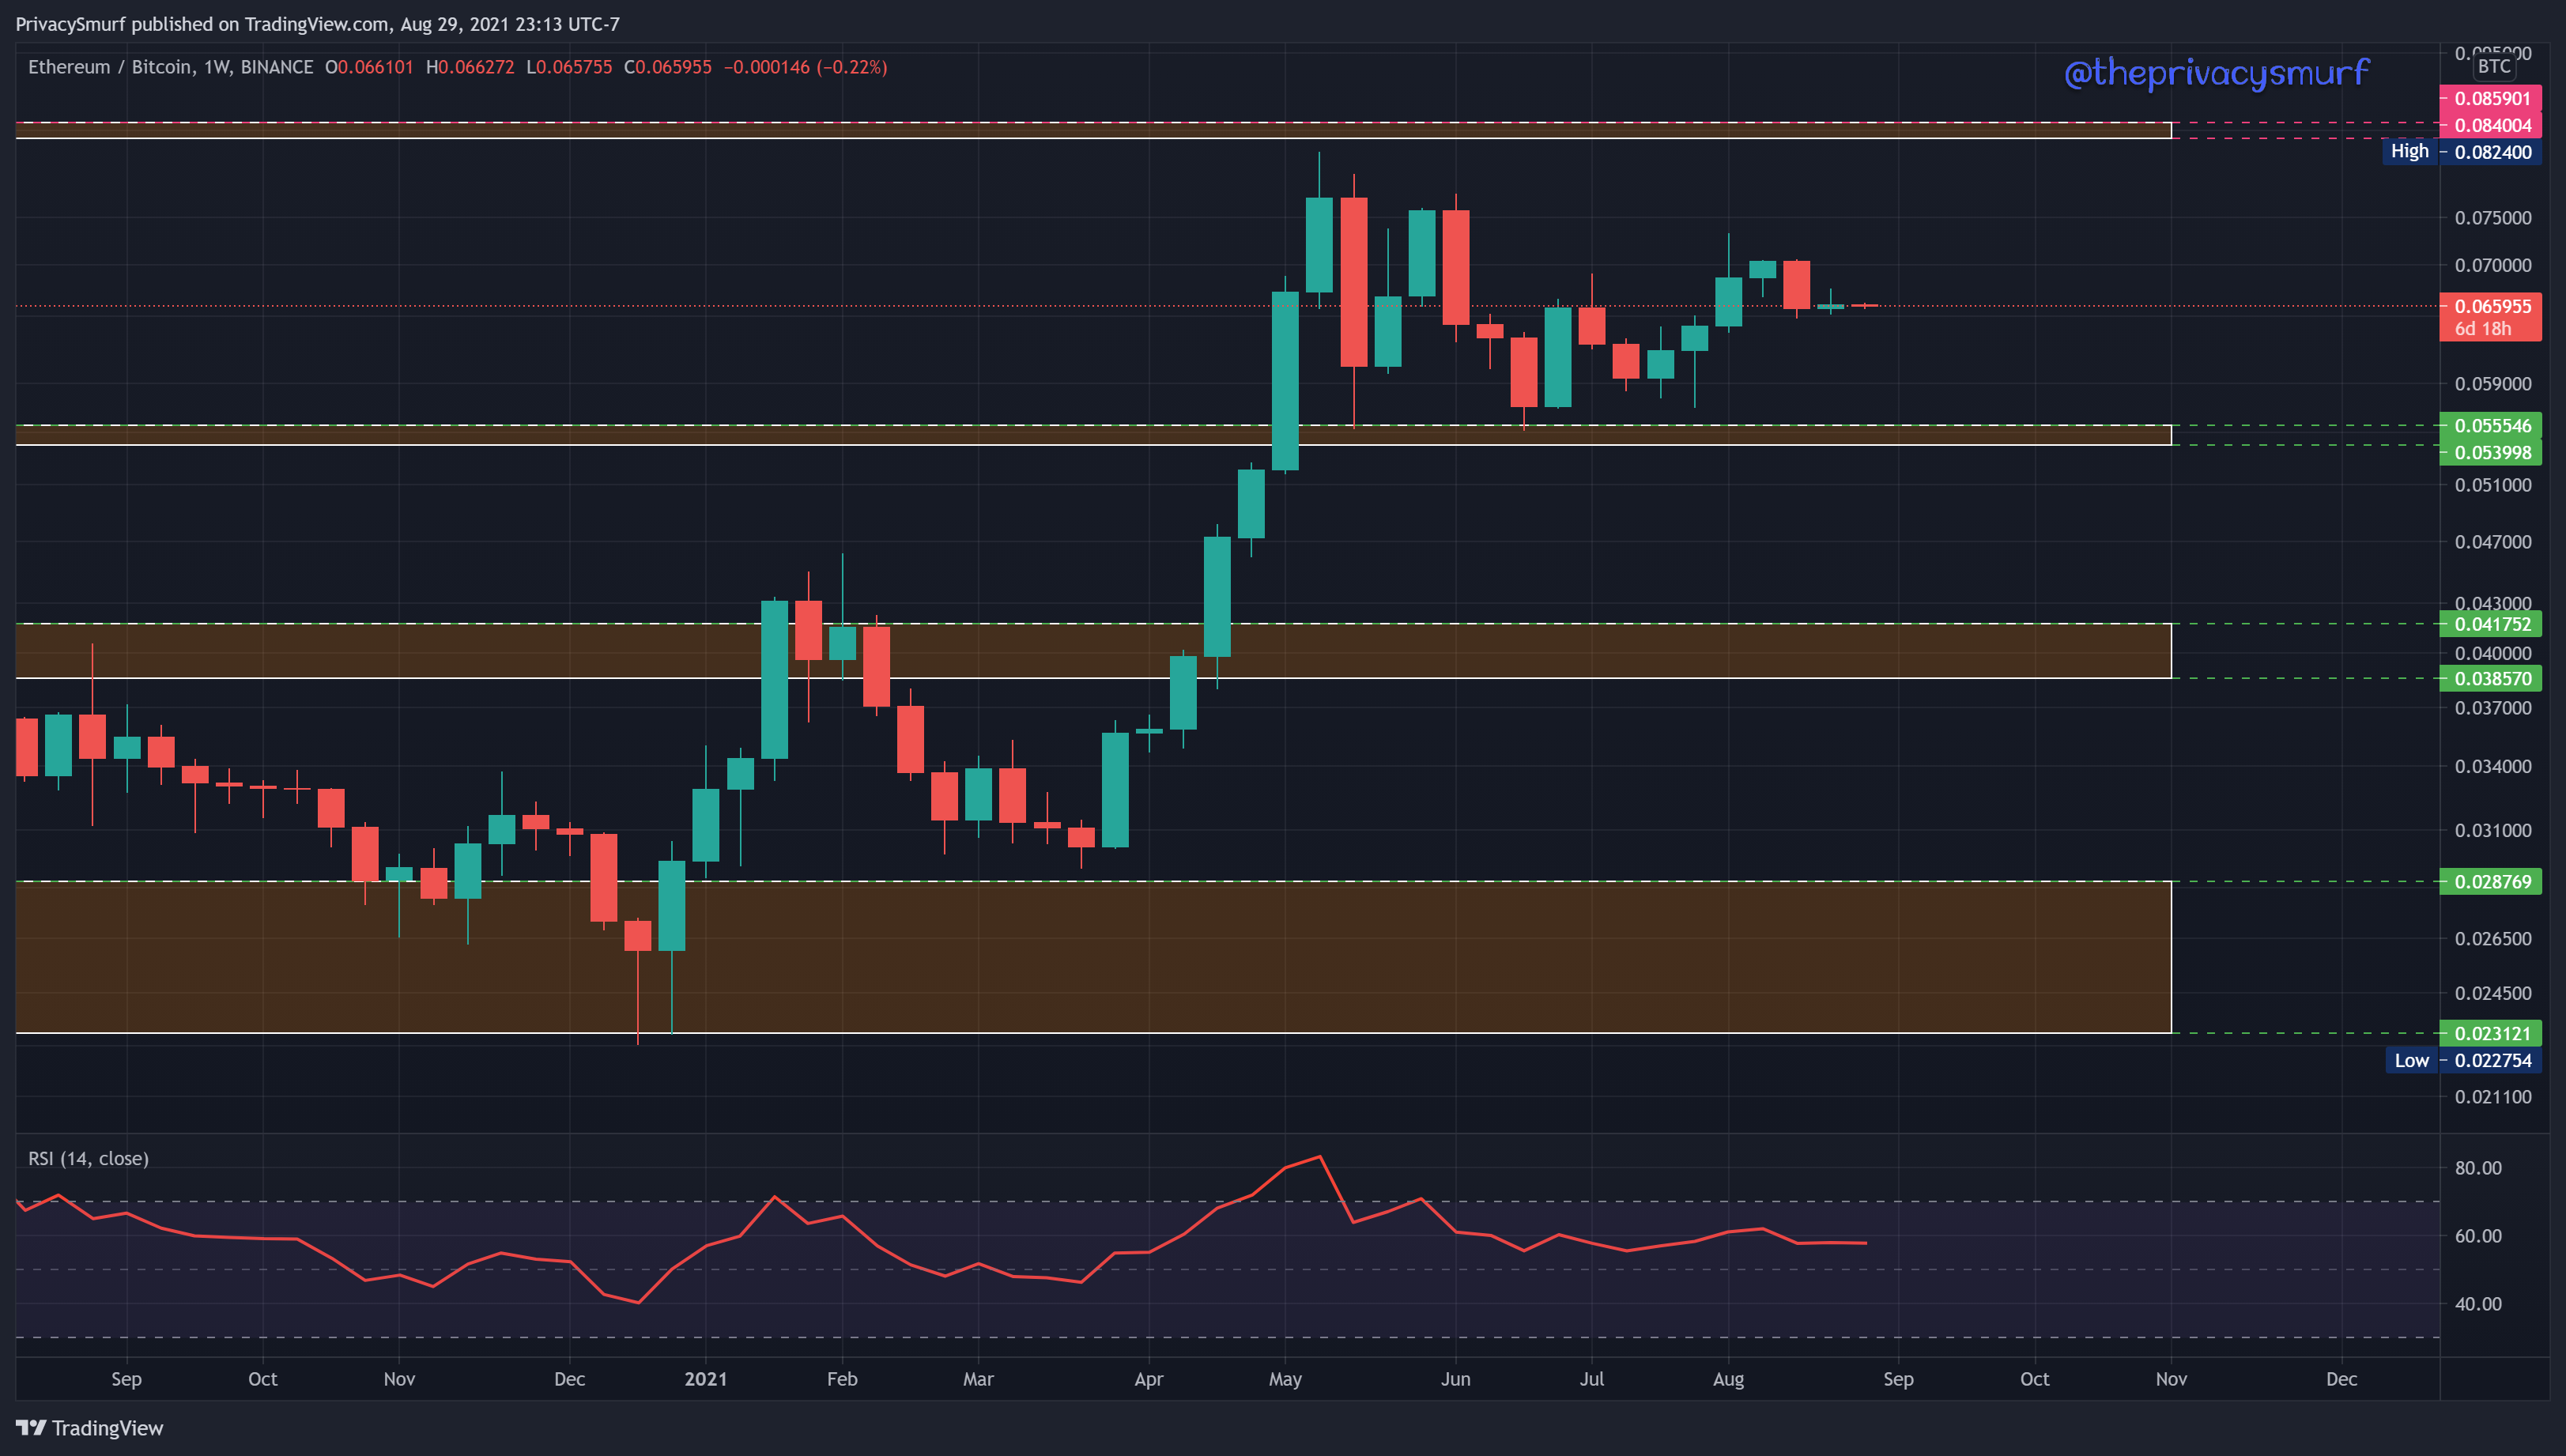
ETH hasn’t made any headway in the relation to BTC. It hardly moved any although it was a green week. There’s really no insight here.
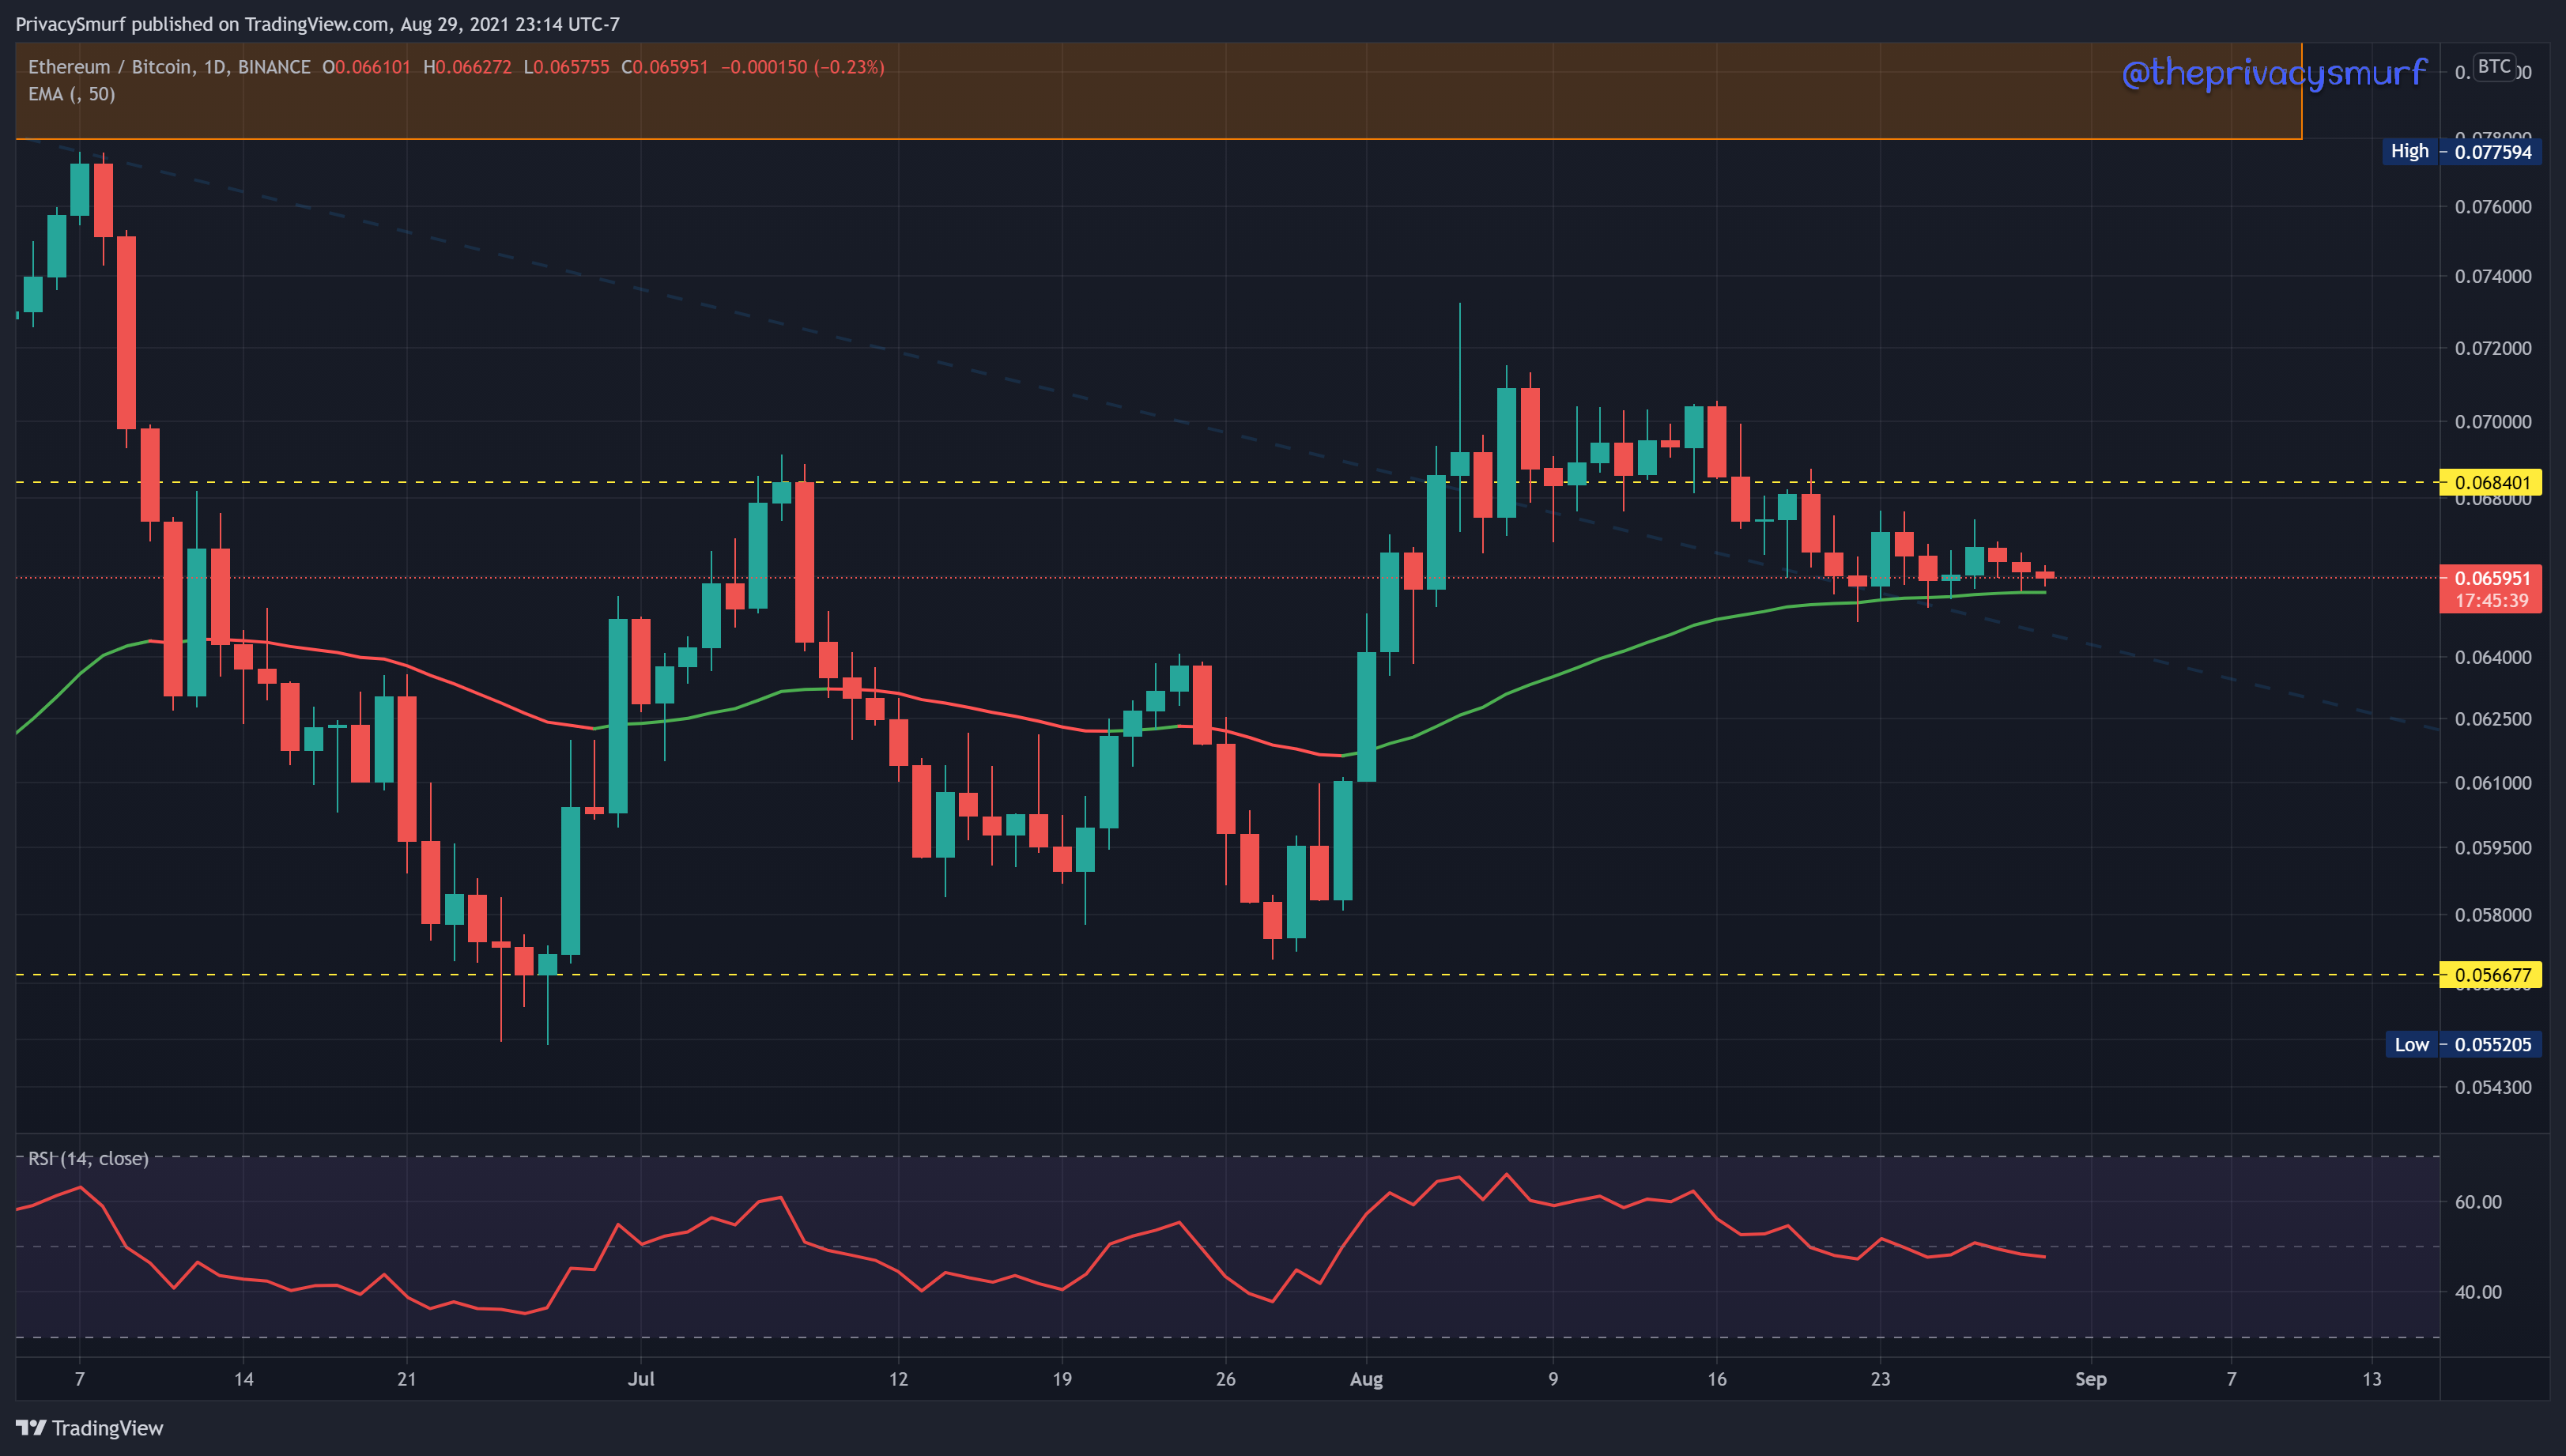
The daily chart show ETH hanging by a thread. The RSI continues to fail to breach the midline. The 50-Day EMA is holding as a support for the time being but that may go away in the near future. The breach and test of the descending trendline from recent high closes is technically holding as support. If the EMA fails to hold I would expect the trendline to go as well. I’d be interested in Buying some ETH with BTC down in a zone from 0.0566-0.0595 although that value may not show up anytime soon.
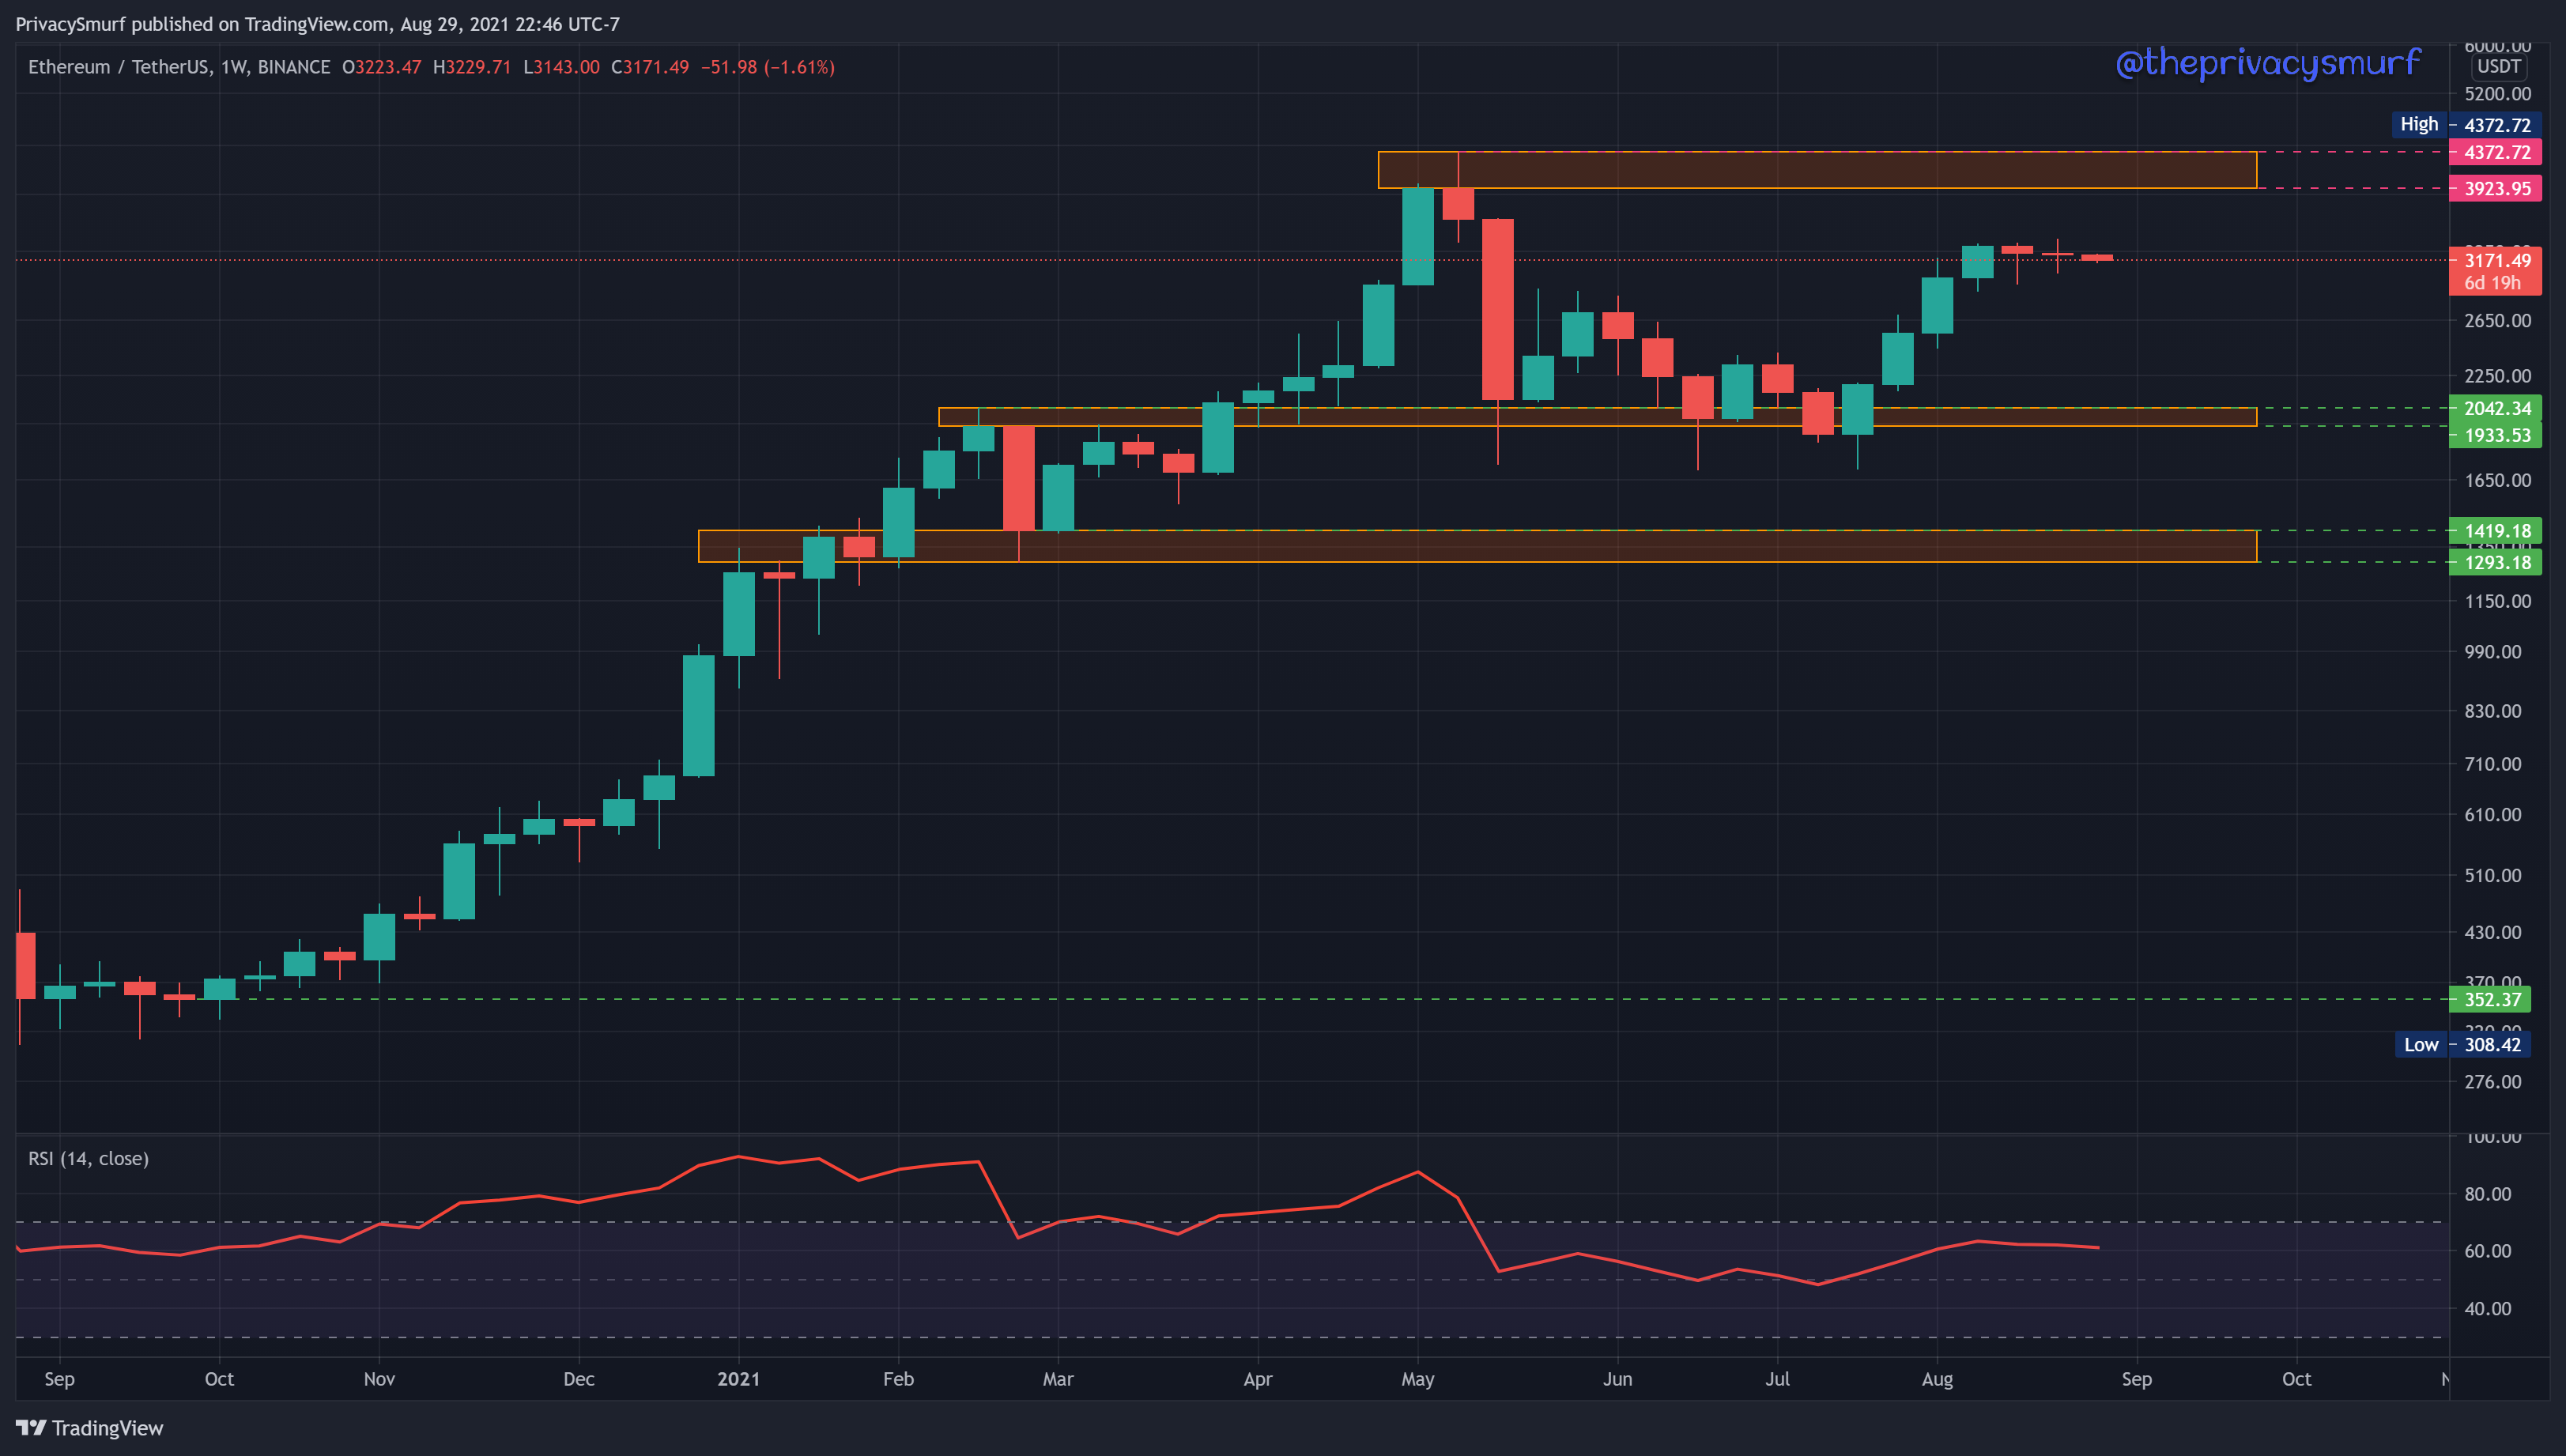
Looking at the ETH/USDT weekly chart it’s a similar stagnant picture. A smaller timeframe is necessary to glean some direction.
The daily picture shows a descending trendline and the $3375 holding as resistance. The RSI is steadily declining. I’d be watching for a bullish can’t pattern in a zone above $2884 up to just over $3000. This region has held as support previously, will have the 50-Day EMA just under as extra support and the RSI will likely be testing the midline for support as well. The thing to be cautious about that entry though is failure there will be dramatic with the next support far away just under $2600.

There ya go. Quick and easy. I didn’t mention it earlier but I’ve made my TradingView charts public. You can look at the links and see exact charts to make the images above on your computer/device and you can even save a copy to your account for editing to your heart’s desire. I made a quick video about it as well. Be sure to watch the video so you can see the extra stuff I added that you can edit if you make a copy of the charts.
Here are the links.
Enjoy! Hopefully, the markets will cooperate and give us some setups to take about in the Micro Monday tomorrow.
@theprivacysmurf